
All Posts (290)
Sort by
By SPACE.com Staff posted: 17 August 2010
A spacecraft designed to scan the edge of the solar system has turned its gaze back toward Earth, taking an unprecedented look at the solar wind's head-on collision with the planet's magnetic field. NASA's Interstellar Boundary Explorer, known as IBEX, has recorded the first-ever look of the solar wind - the million-miles-per-hour stream of charged particles from the sun - crashing headlong into Earth's magnetosphere, space agency officials said in a statement. The solar wind could strip away the planet's atmosphere if the magnetosphere, a magnetic bubble surrounding the planet, didn't help deflect it. The spacecraft's observations show the solar wind piling up in front of the magnetopause - the boundary between Earth's magnetosphere and space, about 35,000 miles (56,327 km) toward the sun. The interaction is invisible to the human eye, but not to IBEX's sensors.
The observations are expected to yield new insights into how the magnetosphere "force field" works, as well as how thin the uppermost layer of Earth's atmosphere, called the exosphere, actually is, researchers said.
"Where the interaction is strongest, there are only about eight hydrogen atoms per cubic centimeter," study leader Stephen A. Fuselier of Lockheed Martin Space Systems said in a statement. The research is detailed in the July 8 issue of the journal Geophysical Research Letters.
Such observations are a departure for IBEX, which is typically used to look outward. The spacecraft launched in October 2008 to map out the boundary between the solar system and interstellar space. It does so from an orbit that takes eight days to circle the Earth.
Last year, researchers announced that the probe had detected a mysterious ribbon on the edge of the solar system that scientists now think is a reflection of the solar wind.
IBEX also has been responsible for other firsts.
For example, it has directly collected hydrogen and oxygen from the interstellar medium.. And IBEX made the first observations of very fast hydrogen atoms coming from the moon, following decades of speculation about their existence. Many hydrogen atoms become embedded in the moon's surface, so such measurements shed light on the "recycling processes" undergone by particles throughout the solar system.
IBEX uses the most sensitive neutral atom detectors ever flown in space and is building upon measurements made by the two Voyager spacecraft. Voyager 1 and 2, launched in 1977, have reached the interstellar boundary region, but their view is much narrower and more constrained.
"It will take a while before the community comes to a consensus about what the IBEX data really mean," said IBEX principal investigator David McComas, assistant vice president at Southwest Research Institute in San Antonio. "Yet we've already learned much, much more about our place in the solar system."
Posted at 9:08 a.m. on 17 Aug 2010 @ http://sickscent.blogspot.com/
Aug 28, 2010 ... EDIS CODE: HZ-20100828-27598-AUS. - Potentially dangerous radioactive gases have been secretly pumped into the atmosphere from Lucas Heights ...
http://204.74.214.194/forum1/message1174768/pg1 A link with more indormation
http://204.74.214.194/forum1/message1174768/pg1 A link with more indormation
HAITI EARTHQUAKE
SOUTHERN ALASKA 3.7
NORTHERN CA 3.6
HINDU KUSH REGION AFGHANISTAN 4.9
KEPULAUAN TALAUD INDONESIA 4.8
NEAR EAST COAST OF HONSHU JAPAN 4.8
ALASKA PENINSULA 4.6
OFF THE COAST OF JALISCO MEXICO 5.1 (AFTERSHOCK)
BOMBAY BEACH CA SWAM OF QUAKES 1.6 TO 2.5 (12 MINIQUAKES)
SICHUAN-YUNNAN-GUIZHOU REGION CHINA 5.1
MOLUCCA SEA 4.6
GUATEMALA 4.6
NEAR COAST OF HONSHU JAPAN 4.3
WEEKLY SUMMARY
ASIA
AUSTRALIA
EUROPE
NORTH AMERICA
SOUTH AMERICA
SOUTH PACIFIC
JUST A GUT FEELING WATCH FOR JAPAN AND GUATEMALA TO HAVE VALCANO'S ERUPT. PLUS CA WILL HAVE A BIGGY.
ALWAYS ON GUARD, SMALL BUT MIGHTY.
officals issued a red alert after mount sinabung began to spew lava shortly after midnight (1900 GMT). smoke and ash reportedly shot 1,500m into the air and witnesses said they could see lava from the volcano from several miles away.
remember about a week or two ago i said to watch the volcano's. thus it begins.
BOMBAY BEACH CA WHICH IS INLAND IS HAVING A SWAM. SO FAR 12 MINIQUAKES RANGING FROM 1.6 TO 2.5, I WILL BE KEEPING MY EYE ON CALIFORNIA. WATCH FOR POSSIBLY SOMETHING BIGGER.
Do you have a tornado shelter?
http://www.activistpost.com/2010/08/collapse-survival-will-be-tribal-begin.html
Community. Community. Community. We can NOT survive alone. I'm making my move soon. What are your plans? Read Gerald Celente's article in today's Economy News.
NEW GUINEA REGION P.N.G. 5.1
SOUTH SANDWHICH ISLANDS REGION 5.1
NEW BRITAIN REGION P.N.G. 4.8
OFF THE EAST COAST OF KAMCHATKA RUSSIA 4.8
SAN FRANCISCO BAY 2.6
NORTHERN IRAN 5.7
TURKMENISTAN 4.9
Analysis of artificiality in Stereo: Final Conclusions: Aetherofactos. Anomalies for 16 to August 28.
Posted on September 9, 2009
A guide to understanding COR2 STEREO coronagraph.
For this study we will confine only to the coronagraph COR2.
http://starviewer.files.wordpress.com/2009/09/b0.jpg?w=700&h=563
Click on link to view photo
A guide to understanding the position of Stereo
In this case the times the images are printed on a reverse time sequence to the previous example. This data may be misleading because the labeling is performed after selecting the final image.
FOV (range of observation): 2.0 - 15 Rsun (solar radii)
Resolution: 29.4 white light arc-sec
Cadence: an image every 20-30 min
Sequence of images taken with a polarizer in three positions of 0, 120 and 240
http://starviewer.files.wordpress.com/2009/09/disenooptico.jpg?w=696&h=186
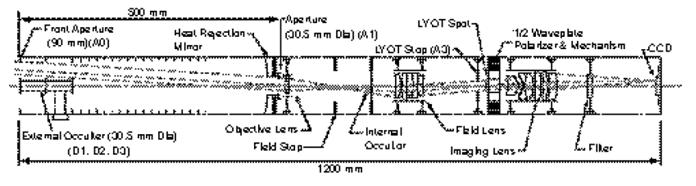
Click to see image
Stereo Optical design.
Resolution and Vignetting (relative area of the pupil):
http://starviewer.files.wordpress.com/2009/09/b2.jpg?w=338&h=203
Click to view image
http://starviewer.files.wordpress.com/2009/09/b1.jpg?w=325&h=203
Click to view image
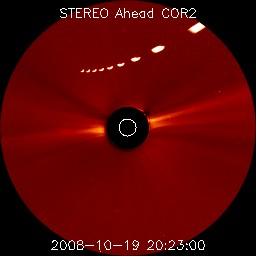
4.-COR 2 images.
The Shadow COR2 made a certain exposure duration and cadence of 2 minutes between them with three different polar angles (0, 120 and 240 degrees). Once the shots, are stored and create sets of files called cor_polarize summary. STEREO software has, among others, certain routines that are responsible for looking at these summary files and find sets of three images taken in the COR 2, with the angles above and sequence of two minutes of each other in a maximum interval of 15 minutes between the first and last. If you find this series of three images and the rhythm is right, makes a FITS file polarized total brightness polarized triplet is the final image.
For images that do not have final processing will be called Stage 1. To those who only have a DOS polarized angles, Stage 2 will be called and which have been processed in full, STEP 3.
We see these images perfectly using image enhancement process mentioned above:
Stage 1, 2 and 3:
http://starviewer.files.wordpress.com/2009/09/b3.jpg?w=597&h=206
Click to view image
Stage> 1 mark
Stage> 3 marks
Stage> 9 marks
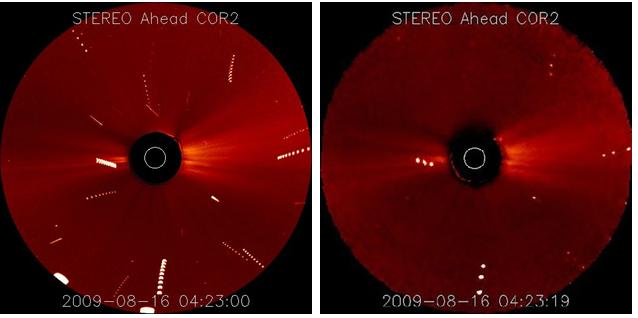
STEREO images in which you can see this process of improvement:
Image that you can see the different layers polarized in the halos of the disk and the luminosity:
http://starviewer.files.wordpress.com/2009/09/b4.jpg?w=700&h=259
Click to view
In this case the times the images are printed on a reverse time sequence to the previous example. This data may be misleading because the labeling is performed after selecting the final image.
Note that the bright spot-at 2:00 in image 3 -, and shows the planet Venus, it seems that does not show the same effect of repetition of points because the rate of motion of the planet in the image is very small.
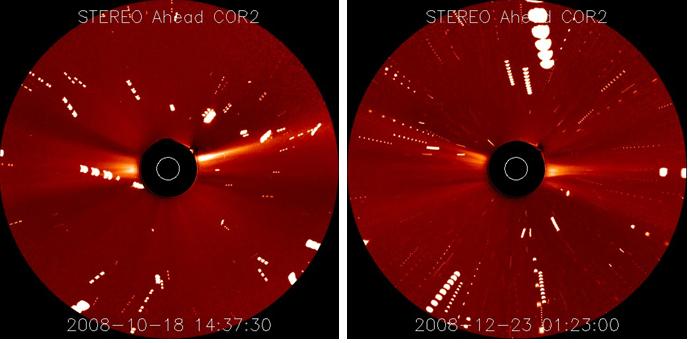
Note these two images of the August 17, 2008:
Image that you can see the different layers polarized in the halos of the disk and the luminosity:
http://starviewer.files.wordpress.com/2009/09/b6.jpg?w=526&h=355
Click to view
Luminosities Aetherofactales
http://starviewer.files.wordpress.com/2009/09/b7.jpg?w=551&h=236
Click to view
A new example of the process also enables us to find the address of each light:
http://starviewer.files.wordpress.com/2009/09/b81.jpg?w=638&h=318
Click to view
In this case the times the images are printed on a reverse time sequence to the previous example. This data may be misleading because the labeling is performed after selecting the final image.
Note that the bright spot-at 2:00 in image 3 -, and shows the planet Venus, it seems that does not show the same effect of repetition of points because the rate of motion of the planet in the image is very small.
Note these two images of the August 17, 2008:
http://starviewer.files.wordpress.com/2009/09/b111.jpg?w=673&h=338
Click
In the course of 30 minutes the same pattern of six lights, what appears to be an intermediate stage between the 2 and 3.
In these images we can see that the light pattern is different types of lines and turns of all kinds:
http://starviewer.files.wordpress.com/2009/09/b131.jpg?w=644&h=576
Click
The previous images completely ruled shutter a possible defect and observed even turns in both directions, as the image on the right.
Intensities and sizes
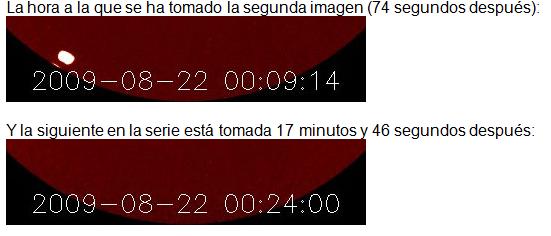
We can also often observe different intensities of light that left these bright points in the images and they are inversely proportional to the length of the trace marked. These differences in intensity are due to different exposure times and therefore also to the different speeds:
a) A MAYOR travel speed of light -> less intensity and longer trace.
b) b) The lower the travel speed of light -> higher intensity and shorter trace.
In the following pictures you can see how the point of light in different intensities left the film due to increased speed (lower intensity and longer trace). This change in velocity could be due either to increased speed and the proximity of the object to the camera. We can find out which of the two parameters is more correct by the width of the trace. If it (the trace) is wider in the less light means that the speed increase is due to the object moon closer to the camera.
In the case of the following images, the speed increase is very high probability for bringing light to the camera point COR2.
http://starviewer.files.wordpress.com/2009/09/b141.jpg?w=680&h=346
Click
Like these:
http://starviewer.files.wordpress.com/2009/09/b151.jpg?w=681&h=340
Click
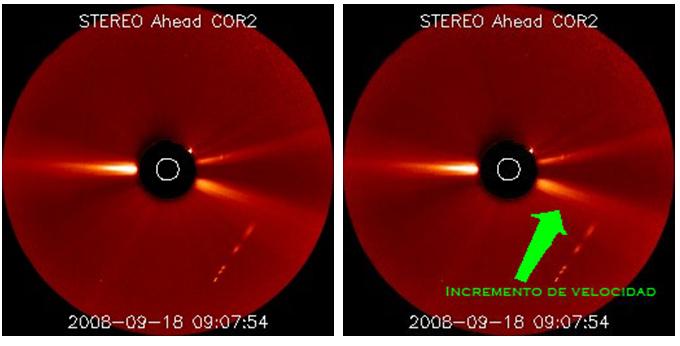
In the next image is not seen a large increase in the vicinity (that is, although lower), but an increase in speed by the separation between the pearls of light
http://starviewer.files.wordpress.com/2009/09/b152.jpg?w=681&h=340
Click
http://starviewer.files.wordpress.com/2009/09/b161.jpg?w=257&h=260
Click
When there is a sudden decrease of the brightness in one of the ends of the string of pearls of light, without any sign of increased length of the trace that would indicate more speed, what happens is easily explained if we think that far less light chain of pearls has been less exposure time because has closed the shutter. This case there will be no interior in a pearl chain.
An example of this is the image:
http://starviewer.files.wordpress.com/2009/09/b171.jpg?w=257&h=257
Click
It is clear that the bright spot at the far right is clearly less bright but maintains the same or very similar size as the previous trace.
In the following pictures we will see a true compendium of types of chains and trace widths:
http://starviewer.files.wordpress.com/2009/09/b181.jpg?w=688&h=343
Click
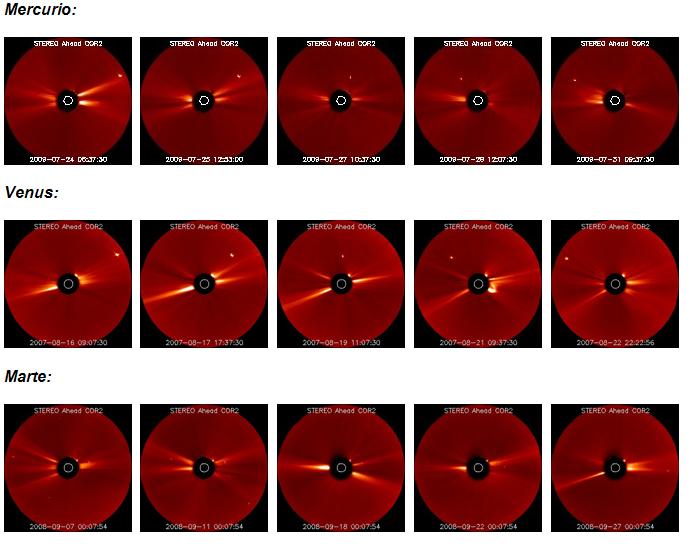
The planets visible from Stereo:
To see the difference between strings of pearls and had previously studied the planets captured by COR2, consider the following final images (STEP 3):
http://starviewer.files.wordpress.com/2009/09/b191.jpg?w=693&h=546
Click
http://starviewer.files.wordpress.com/2009/09/b201.jpg?w=694&h=357
Click
We can clearly see the clear difference between the impressions left by the planets and the "chains of pearls" left by other devices, they all have the same type of processing polarizer and the same exposure time.
Obvious artificiality.
After the analysis we can conclude that when two images are those COR string of pearls, we are eyewitnesses of the different impressions left by certain objects in the images of movement and speed variables and with evident signs of AI.
References:
System Suite Instrument Description ", Naval Research Laboratory / Praxis, Inc.
SECCHI Sun Earth Connection Coronal and Heliospheric Investigation (http://secchi.pxi.com)
STEREO / SECCHI - COR1_PBSERIES () (http://achilles.nascom.nasa.gov)
STEREO / SECCHI - SCCDOPOLAR () (http://achilles.nascom.nasa.gov/)
"Inner COR1 SECCHI coronagraph for STEREO-SECCHI" - William T. Thompson1, Joseph M. Davila2, Richard R. Fisher2 and others.
The Radiometric and pointing calibration of COR1 SECCHI on STEREO "- WT Thompson, NL Reginald.
- “STEREO SCIENCE WRITERS GUIDE” – National Aeronautics and Space Administration (http://www.nasa.gov)
- StarVieWerTeam (Thanks to Dadrev).
Tagged: aetherocuántica, Aetherofactos, aetherofactos August 16, aetherometry loops, antigravity, antigravity concepts, report conclusions, final report artificiality, extraterrestrial intelligence, artificial patterns 1608, STEREO
Posted in: intelligent artifacts in space, General Astrophysics, Scientific modeling century, antigravity