
Earth Watch Report – Saturday August 25th, 2012
August 25, 2012 by desertrose
Solar Activity
 Solar wind X-ray Solar Flares
Daily Sun: 25 Aug 12
A new sunspot is emerging at the circled location. Credit: SDO/HMI
Sunspot number: 69 Spotless Days The Radio Sun
Current Auroral Oval:  Switch to: Europe, USA, New Zealand, Antarctica
Planetary K-index Interplanetary Mag. Field
Coronal Holes: 25 Aug 12
A stream of solar wind flowing from the indicated coronal hole should reach Earth on Aug. 26-27. Credit: SDO/AIA.
Updated at: 2012 Aug 24 2200 UTC
Geomagnetic Storms: Updated at: 2012 Aug 24 2200 UTC Mid-latitudes
High latitudes
|

![]()
Link Found Between Cold European Winters and Solar Activity
ScienceDaily
Scientists have long suspected that the Sun’s 11-year cycle influences climate of certain regions on Earth. Yet records of average, seasonal temperatures do not date back far enough to confirm any patterns. Now, armed with a unique proxy, an international team of researchers show that unusually cold winters in Central Europe are related to low solar activity — when sunspot numbers are minimal. The freezing of Germany’s largest river, the Rhine, is the key.

Although Earth’s surface overall continues to warm, the new analysis has revealed a correlation between periods of low activity of the Sun and of some cooling — on a limited, regional scale in Central Europe, along the Rhine.
“The advantage with studying the Rhine is because it’s a very simple measurement,” said Frank Sirocko lead author of a paper on the study and professor of Sedimentology and Paleoclimatology at the Institute of Geosciences of Johannes Gutenberg University in Mainz, Germany. “Freezing is special in that it’s like an on-off mode. Either there is ice or there is no ice.”
From the early 19th through mid-20th centuries, riverboat men used the Rhine for cargo transport. And so docks along the river have annual records of when ice clogged the waterway and stymied shipping. The scientists used these easily-accessible documents, as well as other additional historical accounts, to determine the number of freezing episodes since 1780.
Sirocko and his colleagues found that between 1780 and 1963, the Rhine froze in multiple places fourteen different times. The sheer size of the river means it takes extremely cold temperatures to freeze over making freezing episodes a good proxy for very cold winters in the region, Sirocko said.
Mapping the freezing episodes against the solar activity’s 11-year cycle — a cycle of the Sun’s varying magnetic strength and thus total radiation output — Sirocko and his colleagues determined that ten of the fourteen freezes occurred during years when the Sun had minimal sunspots. Using statistical methods, the scientists calculated that there is a 99 percent chance that extremely cold Central European winters and low solar activity are inherently linked.
“We provide, for the first time, statistically robust evidence that the succession of cold winters during the last 230 years in Central Europe has a common cause,” Sirocko said.
With the new paper, Sirocko and his colleagues have added to the research linking solar variability with climate, said Thomas Crowley, Director of the Scottish Alliance for Geoscience, Environment, and Society, who was not involved with the study.
“There is some suspension of belief in this link,” Crowley said, “and this study tilts the argument more towards thinking there really is something to this link. If you have more statistical evidence to support this explanation, one is more likely to say it’s true.”
The study, conducted by researchers at Johannes Gutenberg and the Institute for Atmospheric and Climate Science in Zurich, Switzerland, is set to be published August 25 in Geophysical Research Letters, a journal of the American Geophysical Union.
When sunspot numbers are down, the Sun emits less ultraviolet radiation. Less radiation means less heating of Earth’s atmosphere, which sparks a change in the circulation patterns of the two lowest atmospheric levels, the troposphere and stratosphere. Such changes lead to climatic phenomena such as the North Atlantic Oscillation, a pattern of atmospheric pressure variations that influences wind patterns in the North Atlantic and weather behavior in regions in and around Europe.
“Due to this indirect effect, the solar cycle does not impact hemispherically averaged temperatures, but only leads to regional temperature anomalies,” said Stephan Pfahl, a co-author of the study who is now at the Institute for Atmospheric and Climate Science in Zurich.
The authors show that this change in atmospheric circulation leads to cooling in parts of Central Europe but warming in other European countries, such as Iceland. So, sunspots don’t necessarily cool the entire globe — their cooling effect is more localized, Sirocko said.
In fact, studies have suggested that the extremely cold European winters of 2010 and 2011 were the result of the North Atlantic Oscillation, which Sirocko and his team now link to the low solar activity during that time.
The 2010 and 2011 European winters were so cold that they resulted in record lows for the month of November in certain countries. Some who dispute the occurrence of anthropogenic climate change argue that this two-year period shows that Earth’s climate is not getting any warmer. But climate is a complex system, Sirocko said. And a short-term, localized dip in temperatures only temporarily masks the effects of a warming world.
“Climate is not ruled by one variable,” said Sirocko. “In fact, it has [at least] five or six variables. Carbon dioxide is certainly one, but solar activity is also one.”
Moreover, the researchers also point out that, despite Central Europe’s prospect to suffer colder winters every 11 years or so, the average temperature of those winters is increasing and has been for the past three decades. As one piece of evidence of that warming, the Rhine River has not frozen over since 1963. Sirocko said such warming results, in part, from climate change.
To establish a more complete record of past temperature dips, the researchers are looking to other proxies, such as the spread of disease and migratory habits.
“Disease can be transported by insects and rats, but during a strong freezing year that is not likely,” said Sirocko. “Also, Romans used the Rhine to defend against the Germanics, but as soon as the river froze people could move across it. The freezing of the Rhine is very important on historical timescales.”
It wasn’t, however, the Rhine that first got Sirocko to thinking about the connection between freezing rivers and sunspot activity. In fact, it was a 125-mile ice-skating race he attended over 20 years ago in the Netherlands that sparked the scientist’s idea.
“Skaters can only do this race every 10 or 11 years because that’s when the rivers freeze up,” Sirocko said. “I thought to myself, ‘There must be a reason for this,’ and it turns out there is.”
************************************************************************************************************
Space
Earth approaching objects (objects that are known in the next 30 days) |
|||||||||
| Object Name | Apporach Date | Left | AU Distance | LD Distance | Estimated Diameter* | Relative Velocity | |||
| (2012 FM52) | 25th August 2012 | 0 day(s) | 0.0599 | 23.3 | 510 m – 1.1 km | 17.17 km/s | 61812 km/h | ||
| 66146 (1998 TU3) | 25th August 2012 | 0 day(s) | 0.1265 | 49.2 | 3.0 km – 6.8 km | 16.03 km/s | 57708 km/h | ||
| (2009 AV) | 26th August 2012 | 1 day(s) | 0.1615 | 62.8 | 670 m – 1.5 km | 22.51 km/s | 81036 km/h | ||
| 331769 (2003 BQ35) | 28th August 2012 | 3 day(s) | 0.1585 | 61.7 | 240 m – 530 m | 4.64 km/s | 16704 km/h | ||
| (2010 SC) | 28th August 2012 | 3 day(s) | 0.1679 | 65.3 | 16 m – 36 m | 9.56 km/s | 34416 km/h | ||
| 4769 Castalia | 28th August 2012 | 3 day(s) | 0.1135 | 44.2 | 1.4 km | 12.06 km/s | 43416 km/h | ||
| (2012 LU7) | 02nd September 2012 | 8 day(s) | 0.1200 | 46.7 | 440 m – 990 m | 8.16 km/s | 29376 km/h | ||
| (2012 FS35) | 02nd September 2012 | 8 day(s) | 0.1545 | 60.1 | 2.3 m – 5.2 m | 2.87 km/s | 10332 km/h | ||
| (2012 HG31) | 03rd September 2012 | 9 day(s) | 0.0716 | 27.9 | 440 m – 990 m | 10.33 km/s | 37188 km/h | ||
| (2012 PX) | 04th September 2012 | 10 day(s) | 0.0452 | 17.6 | 61 m – 140 m | 9.94 km/s | 35784 km/h | ||
| (2012 EH5) | 05th September 2012 | 11 day(s) | 0.1613 | 62.8 | 38 m – 84 m | 9.75 km/s | 35100 km/h | ||
| (2011 EO11) | 05th September 2012 | 11 day(s) | 0.1034 | 40.2 | 9.0 m – 20 m | 8.81 km/s | 31716 km/h | ||
| (2007 PS25) | 06th September 2012 | 12 day(s) | 0.0497 | 19.3 | 23 m – 52 m | 8.50 km/s | 30600 km/h | ||
| 329520 (2002 SV) | 08th September 2012 | 14 day(s) | 0.1076 | 41.9 | 300 m – 670 m | 9.17 km/s | 33012 km/h | ||
| (2011 ES4) | 10th September 2012 | 16 day(s) | 0.1792 | 69.8 | 20 m – 44 m | 12.96 km/s | 46656 km/h | ||
| (2008 CO) | 11th September 2012 | 17 day(s) | 0.1847 | 71.9 | 74 m – 160 m | 4.10 km/s | 14760 km/h | ||
| (2007 PB8) | 14th September 2012 | 20 day(s) | 0.1682 | 65.5 | 150 m – 340 m | 14.51 km/s | 52236 km/h | ||
| 226514 (2003 UX34) | 14th September 2012 | 20 day(s) | 0.1882 | 73.2 | 260 m – 590 m | 25.74 km/s | 92664 km/h | ||
| (1998 QC1) | 14th September 2012 | 20 day(s) | 0.1642 | 63.9 | 310 m – 700 m | 17.11 km/s | 61596 km/h | ||
| (2002 EM6) | 15th September 2012 | 21 day(s) | 0.1833 | 71.3 | 270 m – 590 m | 18.56 km/s | 66816 km/h | ||
| (2002 RP137) | 16th September 2012 | 22 day(s) | 0.1624 | 63.2 | 67 m – 150 m | 7.31 km/s | 26316 km/h | ||
| (2009 RX4) | 16th September 2012 | 22 day(s) | 0.1701 | 66.2 | 15 m – 35 m | 8.35 km/s | 30060 km/h | ||
| (2005 UC) | 17th September 2012 | 23 day(s) | 0.1992 | 77.5 | 280 m – 640 m | 7.55 km/s | 27180 km/h | ||
| (2012 FC71) | 18th September 2012 | 24 day(s) | 0.1074 | 41.8 | 24 m – 53 m | 3.51 km/s | 12636 km/h | ||
| (1998 FF14) | 19th September 2012 | 25 day(s) | 0.0928 | 36.1 | 210 m – 480 m | 21.40 km/s | 77040 km/h | ||
| 331990 (2005 FD) | 19th September 2012 | 25 day(s) | 0.1914 | 74.5 | 320 m – 710 m | 15.92 km/s | 57312 km/h | ||
|
|||||||||
………………………………………..
ICELAND AURORAS:
As the midnight sun sets, aurora season has resumed around the Arctic Circle. Last night’s display was photographed by Antony Spencer from Kirkufell, Snaefellsnes, Iceland:
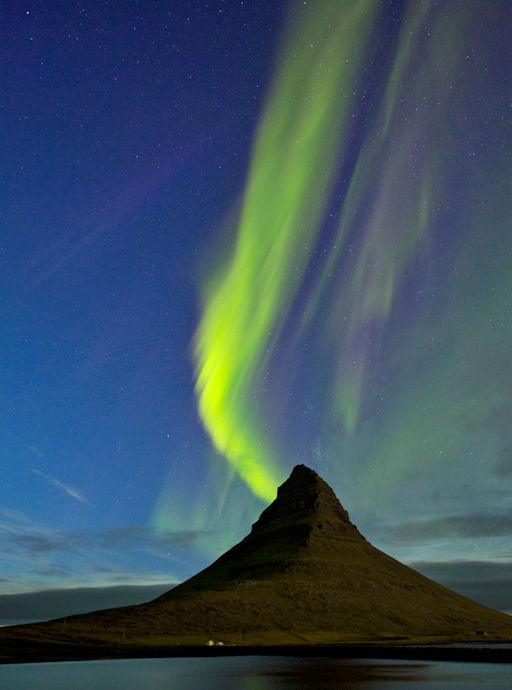
“The midnight sun is now long gone in Iceland,” says Spencer. “I was heading back from a sunset photo shoot when I noticed the auroras. They were bright enough to see right through the sunset colors.”
More auroras are in the offing. A stream of solar wind is heading for Earth, due to arrive on August 26-27.
STARWATER – A Look at Our Changing Planet
Published on Aug 24, 2012 by Suspicious0bservers
Information courtesy of NASA, NOAA, the US Library, the Goddard Space Flight Center, the Jet Propulsion Lab, the Environmental Visualization Laboratory, the NASA Earth Observatory, SDO, SOHO, Stereo, ISWA, SSEC, HAARP, and SolarIMG – Your information, images, and videos were essential to this video.
Song: ‘Archangel’ by Two Steps from Hell
And Thanks to Billy for the use of His Video: YOUTUBE CHANNEL – Mr2tuff2
http://www.plasma-universe.com/index.php/Marklund_convection
Mars Water: http://science.nasa.gov/science-news/science-at-nasa/2001/ast05jan_1/
Enceladus Water: http://science.nasa.gov/science-news/science-at-nasa/2006/09mar_enceladus/
Io Water: http://www.nasa.gov/home/hqnews/1993/93-107.txt
Pluto: http://spaceplace.nasa.gov/review/i-see-ice/page_14.html
WATER EVERYWHERE! NASA Space Place: http://spaceplace.nasa.gov/review/i-see-ice/#/review/i-see-ice/game.html
Water in Pre-Planetary Nebulae: http://journals.cambridge.org/action/displayAbstract?fromPage=online&aid=…
Water at Solar System Birth: http://www.nasa.gov/mission_pages/spitzer/news/spitzer-20070829.html
Stars Born of Icy Gas and Dust: http://www.nasa.gov/multimedia/imagegallery/image_feature_966.html
Water in Star Ring: http://www.nasa.gov/mission_pages/herschel/multimedia/pia14870graph.html
Star Gas Jets: http://www.cv.nrao.edu/~awootten/s106fir.html
Black Hole Gas Jets: http://www.nasa.gov/topics/universe/features/radio-particle-jets.html and http://www.nasa.gov/topics/universe/features/black-hole-jets.html
Star Shooting Water Bullets: http://news.nationalgeographic.com/news/2011/06/110613-space-science-star-wat…
Water around Carbon Star: http://www.nasa.gov/mission_pages/herschel/hershelCWLeonis20100901.html
Water IN Brown Dwarfs: http://www.nasa.gov/vision/universe/starsgalaxies/brown_dwarf_detectives.html
Water in Late Type Stars: http://ntrs.nasa.gov/archive/nasa/casi.ntrs.nasa.gov/19840026277_1984026277.pdf
Water around Dying Star: http://science.nasa.gov/science-news/science-at-nasa/2001/ast11jul_1/
Hot Flow Anomaly: http://www.space.com/14796-venus-space-weather-explosions.html
Magnetic Reconnection: http://ia700500.us.archive.org/15/items/CIL-10110/reconnectionAng_512kb.mp4
More Quakes: http://www.thehorizonproject.com/earthquakes.cfm
Summer Ozone Holes over the US: http://news.nationalgeographic.com/news/2012/07/120726-storms-ozone-hole-glob…
Pilot Mistakes Venus for Airplane: http://news.cnet.com/8301-17852_3-57415375-71/pilot-mistakes-venus-for-plane-…
Heavy Elements in CMEs: ftp://sohoftp.nascom.nasa.gov/pub/oldwww/explore/faq/cme.html#CME_COMPOS
CMEs cause Earth Ejections: http://pwg.gsfc.nasa.gov/istp/polar/coronal.html
Longwave Radiation Flow: http://iridl.ldeo.columbia.edu/maproom/.Global/.Precipitation/Pentad_OLR.html
NOAA Environmental Visualization Lab: http://www.nnvl.noaa.gov/Default.php
Thunderstorms = Ozone Holes & UV Radiation: http://www.sciencemag.org/content/337/6096/835.abstract
US Floods: http://en.wikipedia.org/wiki/File:USfloodmap8May2011.png
US Drought: You need no link.
2011 US Tornado Records: http://www.noaanews.noaa.gov/2011_tornado_information.html
US Record Wildfires 2011: http://www.motherjones.com/blue-marble/2012/08/record-wildfire-year
2011 Weather: http://earthsky.org/earth/a-look-back-at-summer-2011s-weather-extremes-and-di…
2011 Texas Fire Record: http://blog.chron.com/sciguy/2011/09/this-historic-texas-wildfire-season-has-…
2011/12 Bad Winter: http://www.Real-Science.com/images-from-the-winter-that-wasnt
2011/12 Winter– Europe Deaths: http://www.worldweatherpost.com/2012/02/03/europe-cold-wave-deaths-hit-200-lo… Europe Cold: http://en.wikipedia.org/wiki/File:NWS-NOAA_Europe_Extreme_minimum_temperature…
Warm US Winter: http://www.whitehouse.gov/blog/2012/03/26/us-winter-2011-2012-fourth-warmest-…
Atmospheric Ions: http://www.google.com/url?sa=t&rct=j&q=electric%20currents%20atmosphe…
Noctilucent Clouds: http://spaceweather.com/archive.php?view=1&day=12&month=07&year=2012 ; http://www.nasa.gov/mission_pages/aim/news/noctilucent-season2012.html ; http://en.wikipedia.org/wiki/Cirrus_cloud ; http://science.nasa.gov/science-news/science-at-nasa/2012/07aug_meteorsmoke/
Was that a meteor lighting up NorCal, Reno last night?
Witnesses said it lit up the sky for four seconds

(KCRA) —Reports of a large meteor had many people buzzing Wednesday morning.
Viewers called the KCRA 3 newsroom and the sheriff’s departments in several parts of Northern California, along with Reno, to ask about a meteor that appeared about 11:15 p.m. Tuesday.
Witnesses said it lasted for about four seconds and lit up the sky.
Online meteor tracking sites and blogs report the meteor could be seen over parts of Oregon, California and Nevada.
Milky Way Now Has a Twin (or Two): Astronomers Find First Group of Galaxies Just Like Ours
ScienceDaily
Research presented Aug. 23, 2012 at the International Astronomical Union General Assembly in Beijing has found the first group of galaxies that is just like ours, a rare sight in the local Universe.

The Milky Way is a fairly typical galaxy on its own, but when paired with its close neighbours — the Magellanic Clouds — it is very rare, and could have been one of a kind, until a survey of our local Universe found another two examples just like us.
Astronomer Dr Aaron Robotham, jointly from the University of Western Australia node of the International Centre for Radio Astronomy Research (ICRAR) and the University of St Andrews in Scotland, searched for groups of galaxies similar to ours in the most detailed map of the local Universe yet, the Galaxy and Mass Assembly survey (GAMA).
“We’ve never found another galaxy system like the Milky Way before, which is not surprising considering how hard they are to spot! It’s only recently become possible to do the type of analysis that lets us find similar groups,” says Dr Robotham.
“Everything had to come together at once: we needed telescopes good enough to detect not just galaxies but their faint companions, we needed to look at large sections of the sky, and most of all we needed to make sure no galaxies were missed in the survey”
Sophisticated simulations of how galaxies form don’t produce many examples similar to the Milky Way and its surrounds, predicting them to be quite a rare occurrence. Astronomers haven’t been able to tell just how rare until now, with the discovery of not just one but two exact matches amongst the hundreds of thousands of galaxies surveyed.
“We found about 3% of galaxies similar to the Milky Way have companion galaxies like the Magellanic Clouds, which is very rare indeed. In total we found 14 galaxy systems that are similar to ours, with two of those being an almost exact match,” says Dr Robotham.
The Milky Way is locked in a complex cosmic dance with its close companions the Large and Small Magellanic Clouds, which are clearly visible in the southern hemisphere night sky. Many galaxies have smaller galaxies in orbit around them, but few have two that are as large as the Magellanic Clouds.
Dr Robotham’s work also found that although companions like the Magellanic Clouds are rare, when they are found they’re usually near a galaxy very like the Milky Way, meaning we’re in just the right place at the right time to have such a great view in our night sky.
“The galaxy we live in is perfectly typical, but the nearby Magellenic Clouds are a rare, and possibly short-lived, occurrence. We should enjoy them whilst we can, they’ll only be around for a few billion more years,” adds Dr Robotham.
Dr Robotham and colleagues have been awarded further time on telescopes in New South Wales and Chile to study these Milky Way twin systems now that they’ve been found.
The Galaxy and Mass Assembly (GAMA) survey is an international collaboration led from ICRAR and the Australian Astronomical Observatory to map our local Universe in closer detail.
ICRAR is a joint venture between Curtin University and The University of Western Australia providing research excellence in the field of radio astronomy.
Comments