All Posts (15455)

Sort by

Health And Wellness Report


Holistic Health   :    Mindfulness / Meditation

Brain scans prove meditation ‘effective in curing mental illness’

(ANI): Mediation, an eastern philosophy which was once dismissed as pretentious, can be effective in treating mental illness, brain scans have proved.

The buzzword is mindfulness. Meditation, which is practiced a lot in India and in parts of Islington, is an NHS-approved treatment that combines conventional psychotherapy with meditation techniques, breathing and yoga.

It is sitting around trying to think about nothing and letting out the occasional “ommmm”.

Meditation has been around since the Seventies, but in the past decade there has been growing evidence that it is highly effective. Researchers at Britain’s most respected medical centers have found that it can halve the risk of relapse for those with depression.

“Psychotherapy involves patients analyzing thoughts and feelings, with the hope that by understanding them some kind of change can be made. Mindfulness has some of this but it also involves meditation,” the Daily Mail quoted Mark Williams, professor of clinical psychology at the University of Oxford’s Department of Psychiatry and co-developer of one of the many variants, Mindfulness-Based Cognitive Therapy (MBCT), said.

“Meditation, which is an ancient practice and part of Eastern spiritual philosophy, involves sitting, usually in silence, and focusing on one thing, such as the sensations of breathing in and out.

“The mind wanders, so you invite your attention to come back to the thing you are focusing on. People who do this regularly feel very calm. And due to modern scanning techniques that measure activity in the brain, we are beginning to understand why,” he said.

Williams’s colleagues in the US and Canada have been able to pinpoint the parts of the brain that undergo changes during meditation, and the results are astonishing.

“Meditation helps to reduce the activity of part of the brain called the amygdala, which governs feelings of stress. Those who are more stressed and anxious have an amygdala that is overactive. Meditating reduces this.

“And there is an effect on the insula, the part of the brain involved in deep emotions, including love.

“We know from other studies that the insula allows us to feel emotions, so when we are heartbroken we really do experience a kind of pain.

“Normally activity in this area is closely linked to the part of the brain involved in analytical thought. So if we have a fight with our partner, we not only feel dreadful but we start to think about why, what this says about our relationship and what might happen if we don’t put it right,” Williams said.

In those with mental illness, this loop becomes overactive – the thinking feeds the emotions, which feeds more thinking until it becomes overwhelming.

“Meditating breaks this cycle by reducing the links between the insula and the parts of the brain that analyse, as we have seen on brain scans.

“It doesn’t stop a person from feeling or thinking but it uncouples these two parts of the brain, giving the patient more control.

“Further to that, we’ve discovered in clinical trials that mindfulness works as well as antidepressants in preventing relapse of depression. It can also be used alongside drugs,” he said.

Janet Jones, 48, was diagnosed with severe depression 10 years ago. The mother of two was introduced to mindfulness in 2008.

“I was very sceptical at first. But gradually it became part of my everyday life,” she said.

“I would find it difficult to get out of bed and when I got to work, I would feel miserable. Once I committed to mindfulness, my approach changed and my life improved. Mindfulness has given me more control over my life. I now know that no matter how painful something is, it will pass,” Jones added. (ANI)

Read more…

Solar Activity & Space

Earth Watch Report – Saturday August 25th, 2012

August 25, 2012 by desertrose

Solar Activity

spaceweather,com

Solar wind
speed: 576.5 km/sec
density: 0.0 protons/cm3
explanation | more data
Updated: Today at 0935 UT

X-ray Solar Flares
6-hr max: B9 0301 UT Aug25
24-hr: C1 0236 UT Aug25
explanation | more data
Updated: Today at: 0900 UT

Daily Sun: 25 Aug 12

A new sunspot is emerging at the circled location. Credit: SDO/HMI

Sunspot number: 69
What is the sunspot number?
Updated 25 Aug 2012

Spotless Days
Current Stretch: 0 days
2012 total: 0 days (0%)
2011 total: 2 days (<1%)
2010 total: 51 days (14%)
2009 total: 260 days (71%)
Since 2004: 821 days
Typical Solar Min: 486 days
Update 25 Aug 2012

The Radio Sun
10.7 cm flux: 104 sfu
explanation | more data
Updated 25 Aug 2012

Current Auroral Oval:

Switch to: Europe, USA, New Zealand, Antarctica
Credit: NOAA/POES

Planetary K-index
Now: Kp= 3 quiet
24-hr max: Kp= 3 quiet
explanation | more data

Interplanetary Mag. Field
Btotal: 6.7 nT
Bz: 5.7 nT north
explanation | more data
Updated: Today at 0936 UT

Coronal Holes: 25 Aug 12

A stream of solar wind flowing from the indicated coronal hole should reach Earth on Aug. 26-27. Credit: SDO/AIA.

SPACE WEATHER
NOAA Forecasts

Updated at: 2012 Aug 24 2200 UTC

FLARE
0-24 hr
24-48 hr
CLASS M
10 %
10 %
CLASS X
01 %
01 %

Geomagnetic Storms:
Probabilities for significant disturbances in Earth’s magnetic field are given for three activity levels: active, minor storm, severe storm

Updated at: 2012 Aug 24 2200 UTC

Mid-latitudes

0-24 hr
24-48 hr
ACTIVE
20 %
25 %
MINOR
05 %
05 %
SEVERE
01 %
01 %

High latitudes

0-24 hr
24-48 hr
ACTIVE
20 %
15 %
MINOR
30 %
30 %
SEVERE
25 %
35 %

Link Found Between Cold European Winters and Solar Activity

ScienceDaily

Scientists have long suspected that the Sun’s 11-year cycle influences climate of certain regions on Earth. Yet records of average, seasonal temperatures do not date back far enough to confirm any patterns. Now, armed with a unique proxy, an international team of researchers show that unusually cold winters in Central Europe are related to low solar activity — when sunspot numbers are minimal. The freezing of Germany’s largest river, the Rhine, is the key.


Researchers have linked low solar activity to a localized, temporary cooling of Central Europe, by studying the freezing of the Rhine river. (Credit: Warburg via Wikimedia Commons, Creative Commons license)

Although Earth’s surface overall continues to warm, the new analysis has revealed a correlation between periods of low activity of the Sun and of some cooling — on a limited, regional scale in Central Europe, along the Rhine.

“The advantage with studying the Rhine is because it’s a very simple measurement,” said Frank Sirocko lead author of a paper on the study and professor of Sedimentology and Paleoclimatology at the Institute of Geosciences of Johannes Gutenberg University in Mainz, Germany. “Freezing is special in that it’s like an on-off mode. Either there is ice or there is no ice.”

From the early 19th through mid-20th centuries, riverboat men used the Rhine for cargo transport. And so docks along the river have annual records of when ice clogged the waterway and stymied shipping. The scientists used these easily-accessible documents, as well as other additional historical accounts, to determine the number of freezing episodes since 1780.

Sirocko and his colleagues found that between 1780 and 1963, the Rhine froze in multiple places fourteen different times. The sheer size of the river means it takes extremely cold temperatures to freeze over making freezing episodes a good proxy for very cold winters in the region, Sirocko said.

Mapping the freezing episodes against the solar activity’s 11-year cycle — a cycle of the Sun’s varying magnetic strength and thus total radiation output — Sirocko and his colleagues determined that ten of the fourteen freezes occurred during years when the Sun had minimal sunspots. Using statistical methods, the scientists calculated that there is a 99 percent chance that extremely cold Central European winters and low solar activity are inherently linked.

“We provide, for the first time, statistically robust evidence that the succession of cold winters during the last 230 years in Central Europe has a common cause,” Sirocko said.

With the new paper, Sirocko and his colleagues have added to the research linking solar variability with climate, said Thomas Crowley, Director of the Scottish Alliance for Geoscience, Environment, and Society, who was not involved with the study.

“There is some suspension of belief in this link,” Crowley said, “and this study tilts the argument more towards thinking there really is something to this link. If you have more statistical evidence to support this explanation, one is more likely to say it’s true.”

The study, conducted by researchers at Johannes Gutenberg and the Institute for Atmospheric and Climate Science in Zurich, Switzerland, is set to be published August 25 in Geophysical Research Letters, a journal of the American Geophysical Union.

When sunspot numbers are down, the Sun emits less ultraviolet radiation. Less radiation means less heating of Earth’s atmosphere, which sparks a change in the circulation patterns of the two lowest atmospheric levels, the troposphere and stratosphere. Such changes lead to climatic phenomena such as the North Atlantic Oscillation, a pattern of atmospheric pressure variations that influences wind patterns in the North Atlantic and weather behavior in regions in and around Europe.

“Due to this indirect effect, the solar cycle does not impact hemispherically averaged temperatures, but only leads to regional temperature anomalies,” said Stephan Pfahl, a co-author of the study who is now at the Institute for Atmospheric and Climate Science in Zurich.

The authors show that this change in atmospheric circulation leads to cooling in parts of Central Europe but warming in other European countries, such as Iceland. So, sunspots don’t necessarily cool the entire globe — their cooling effect is more localized, Sirocko said.

In fact, studies have suggested that the extremely cold European winters of 2010 and 2011 were the result of the North Atlantic Oscillation, which Sirocko and his team now link to the low solar activity during that time.

The 2010 and 2011 European winters were so cold that they resulted in record lows for the month of November in certain countries. Some who dispute the occurrence of anthropogenic climate change argue that this two-year period shows that Earth’s climate is not getting any warmer. But climate is a complex system, Sirocko said. And a short-term, localized dip in temperatures only temporarily masks the effects of a warming world.

“Climate is not ruled by one variable,” said Sirocko. “In fact, it has [at least] five or six variables. Carbon dioxide is certainly one, but solar activity is also one.”

Moreover, the researchers also point out that, despite Central Europe’s prospect to suffer colder winters every 11 years or so, the average temperature of those winters is increasing and has been for the past three decades. As one piece of evidence of that warming, the Rhine River has not frozen over since 1963. Sirocko said such warming results, in part, from climate change.

To establish a more complete record of past temperature dips, the researchers are looking to other proxies, such as the spread of disease and migratory habits.

“Disease can be transported by insects and rats, but during a strong freezing year that is not likely,” said Sirocko. “Also, Romans used the Rhine to defend against the Germanics, but as soon as the river froze people could move across it. The freezing of the Rhine is very important on historical timescales.”

It wasn’t, however, the Rhine that first got Sirocko to thinking about the connection between freezing rivers and sunspot activity. In fact, it was a 125-mile ice-skating race he attended over 20 years ago in the Netherlands that sparked the scientist’s idea.

“Skaters can only do this race every 10 or 11 years because that’s when the rivers freeze up,” Sirocko said. “I thought to myself, ‘There must be a reason for this,’ and it turns out there is.”

************************************************************************************************************

Space

 Earth approaching objects (objects that are known in the next 30 days)

Object Name Apporach Date Left AU Distance LD Distance Estimated Diameter* Relative Velocity
(2012 FM52) 25th August 2012 0 day(s) 0.0599 23.3 510 m – 1.1 km 17.17 km/s 61812 km/h
66146 (1998 TU3) 25th August 2012 0 day(s) 0.1265 49.2 3.0 km – 6.8 km 16.03 km/s 57708 km/h
(2009 AV) 26th August 2012 1 day(s) 0.1615 62.8 670 m – 1.5 km 22.51 km/s 81036 km/h
331769 (2003 BQ35) 28th August 2012 3 day(s) 0.1585 61.7 240 m – 530 m 4.64 km/s 16704 km/h
(2010 SC) 28th August 2012 3 day(s) 0.1679 65.3 16 m – 36 m 9.56 km/s 34416 km/h
4769 Castalia 28th August 2012 3 day(s) 0.1135 44.2 1.4 km 12.06 km/s 43416 km/h
(2012 LU7) 02nd September 2012 8 day(s) 0.1200 46.7 440 m – 990 m 8.16 km/s 29376 km/h
(2012 FS35) 02nd September 2012 8 day(s) 0.1545 60.1 2.3 m – 5.2 m 2.87 km/s 10332 km/h
(2012 HG31) 03rd September 2012 9 day(s) 0.0716 27.9 440 m – 990 m 10.33 km/s 37188 km/h
(2012 PX) 04th September 2012 10 day(s) 0.0452 17.6 61 m – 140 m 9.94 km/s 35784 km/h
(2012 EH5) 05th September 2012 11 day(s) 0.1613 62.8 38 m – 84 m 9.75 km/s 35100 km/h
(2011 EO11) 05th September 2012 11 day(s) 0.1034 40.2 9.0 m – 20 m 8.81 km/s 31716 km/h
(2007 PS25) 06th September 2012 12 day(s) 0.0497 19.3 23 m – 52 m 8.50 km/s 30600 km/h
329520 (2002 SV) 08th September 2012 14 day(s) 0.1076 41.9 300 m – 670 m 9.17 km/s 33012 km/h
(2011 ES4) 10th September 2012 16 day(s) 0.1792 69.8 20 m – 44 m 12.96 km/s 46656 km/h
(2008 CO) 11th September 2012 17 day(s) 0.1847 71.9 74 m – 160 m 4.10 km/s 14760 km/h
(2007 PB8) 14th September 2012 20 day(s) 0.1682 65.5 150 m – 340 m 14.51 km/s 52236 km/h
226514 (2003 UX34) 14th September 2012 20 day(s) 0.1882 73.2 260 m – 590 m 25.74 km/s 92664 km/h
(1998 QC1) 14th September 2012 20 day(s) 0.1642 63.9 310 m – 700 m 17.11 km/s 61596 km/h
(2002 EM6) 15th September 2012 21 day(s) 0.1833 71.3 270 m – 590 m 18.56 km/s 66816 km/h
(2002 RP137) 16th September 2012 22 day(s) 0.1624 63.2 67 m – 150 m 7.31 km/s 26316 km/h
(2009 RX4) 16th September 2012 22 day(s) 0.1701 66.2 15 m – 35 m 8.35 km/s 30060 km/h
(2005 UC) 17th September 2012 23 day(s) 0.1992 77.5 280 m – 640 m 7.55 km/s 27180 km/h
(2012 FC71) 18th September 2012 24 day(s) 0.1074 41.8 24 m – 53 m 3.51 km/s 12636 km/h
(1998 FF14) 19th September 2012 25 day(s) 0.0928 36.1 210 m – 480 m 21.40 km/s 77040 km/h
331990 (2005 FD) 19th September 2012 25 day(s) 0.1914 74.5 320 m – 710 m 15.92 km/s 57312 km/h
1 AU = ~150 million kilometers,1 LD = Lunar Distance = ~384,000 kilometers Source: NASA-NEO

………………………………………..

ICELAND AURORAS:

As the midnight sun sets, aurora season has resumed around the Arctic Circle. Last night’s display was photographed by Antony Spencer from Kirkufell, Snaefellsnes, Iceland:

“The midnight sun is now long gone in Iceland,” says Spencer. “I was heading back from a sunset photo shoot when I noticed the auroras. They were bright enough to see right through the sunset colors.”

More auroras are in the offing. A stream of solar wind is heading for Earth, due to arrive on August 26-27.

STARWATER – A Look at Our Changing Planet

Published on Aug 24, 2012 by Suspicious0bservers

Information courtesy of NASA, NOAA, the US Library, the Goddard Space Flight Center, the Jet Propulsion Lab, the Environmental Visualization Laboratory, the NASA Earth Observatory, SDO, SOHO, Stereo, ISWA, SSEC, HAARP, and SolarIMG – Your information, images, and videos were essential to this video.

Song: ‘Archangel’ by Two Steps from Hell

And Thanks to Billy for the use of His Video: YOUTUBE CHANNEL – Mr2tuff2
http://www.plasma-universe.com/index.php/Marklund_convection

Mars Water: http://science.nasa.gov/science-news/science-at-nasa/2001/ast05jan_1/
Enceladus Water: http://science.nasa.gov/science-news/science-at-nasa/2006/09mar_enceladus/
Io Water: http://www.nasa.gov/home/hqnews/1993/93-107.txt
Pluto: http://spaceplace.nasa.gov/review/i-see-ice/page_14.html
WATER EVERYWHERE! NASA Space Place: http://spaceplace.nasa.gov/review/i-see-ice/#/review/i-see-ice/game.html

Water in Pre-Planetary Nebulae: http://journals.cambridge.org/action/displayAbstract?fromPage=online&aid=…
Water at Solar System Birth: http://www.nasa.gov/mission_pages/spitzer/news/spitzer-20070829.html
Stars Born of Icy Gas and Dust: http://www.nasa.gov/multimedia/imagegallery/image_feature_966.html
Water in Star Ring: http://www.nasa.gov/mission_pages/herschel/multimedia/pia14870graph.html
Star Gas Jets: http://www.cv.nrao.edu/~awootten/s106fir.html
Black Hole Gas Jets: http://www.nasa.gov/topics/universe/features/radio-particle-jets.html and http://www.nasa.gov/topics/universe/features/black-hole-jets.html
Star Shooting Water Bullets: http://news.nationalgeographic.com/news/2011/06/110613-space-science-star-wat…
Water around Carbon Star: http://www.nasa.gov/mission_pages/herschel/hershelCWLeonis20100901.html
Water IN Brown Dwarfs: http://www.nasa.gov/vision/universe/starsgalaxies/brown_dwarf_detectives.html
Water in Late Type Stars: http://ntrs.nasa.gov/archive/nasa/casi.ntrs.nasa.gov/19840026277_1984026277.pdf
Water around Dying Star: http://science.nasa.gov/science-news/science-at-nasa/2001/ast11jul_1/

Hot Flow Anomaly: http://www.space.com/14796-venus-space-weather-explosions.html
Magnetic Reconnection: http://ia700500.us.archive.org/15/items/CIL-10110/reconnectionAng_512kb.mp4
More Quakes: http://www.thehorizonproject.com/earthquakes.cfm
Summer Ozone Holes over the US: http://news.nationalgeographic.com/news/2012/07/120726-storms-ozone-hole-glob…
Pilot Mistakes Venus for Airplane: http://news.cnet.com/8301-17852_3-57415375-71/pilot-mistakes-venus-for-plane-…
Heavy Elements in CMEs: ftp://sohoftp.nascom.nasa.gov/pub/oldwww/explore/faq/cme.html#CME_COMPOS
CMEs cause Earth Ejections: http://pwg.gsfc.nasa.gov/istp/polar/coronal.html
Longwave Radiation Flow: http://iridl.ldeo.columbia.edu/maproom/.Global/.Precipitation/Pentad_OLR.html

NOAA Environmental Visualization Lab: http://www.nnvl.noaa.gov/Default.php
Thunderstorms = Ozone Holes & UV Radiation: http://www.sciencemag.org/content/337/6096/835.abstract
US Floods: http://en.wikipedia.org/wiki/File:USfloodmap8May2011.png
US Drought: You need no link.
2011 US Tornado Records: http://www.noaanews.noaa.gov/2011_tornado_information.html
US Record Wildfires 2011: http://www.motherjones.com/blue-marble/2012/08/record-wildfire-year
2011 Weather: http://earthsky.org/earth/a-look-back-at-summer-2011s-weather-extremes-and-di…
2011 Texas Fire Record: http://blog.chron.com/sciguy/2011/09/this-historic-texas-wildfire-season-has-…
2011/12 Bad Winter: http://www.Real-Science.com/images-from-the-winter-that-wasnt
2011/12 Winter– Europe Deaths: http://www.worldweatherpost.com/2012/02/03/europe-cold-wave-deaths-hit-200-lo… Europe Cold: http://en.wikipedia.org/wiki/File:NWS-NOAA_Europe_Extreme_minimum_temperature…
Warm US Winter: http://www.whitehouse.gov/blog/2012/03/26/us-winter-2011-2012-fourth-warmest-…
Atmospheric Ions: http://www.google.com/url?sa=t&rct=j&q=electric%20currents%20atmosphe…

Noctilucent Clouds: http://spaceweather.com/archive.php?view=1&day=12&month=07&year=2012 ; http://www.nasa.gov/mission_pages/aim/news/noctilucent-season2012.html ; http://en.wikipedia.org/wiki/Cirrus_cloud ; http://science.nasa.gov/science-news/science-at-nasa/2012/07aug_meteorsmoke/

Was that a meteor lighting up NorCal, Reno last night?

Witnesses said it lit up the sky for four seconds

Sky


Richard Sharp/KCRA

(KCRA) —Reports of a large meteor had many people buzzing Wednesday morning.

Viewers called the KCRA 3 newsroom and the sheriff’s departments in several parts of Northern California, along with Reno, to ask about a meteor that appeared about 11:15 p.m. Tuesday.

Witnesses said it lasted for about four seconds and lit up the sky.

Online meteor tracking sites and blogs report the meteor could be seen over parts of Oregon, California and Nevada.

Milky Way Now Has a Twin (or Two): Astronomers Find First Group of Galaxies Just Like Ours

ScienceDaily

Research presented Aug. 23, 2012 at the International Astronomical Union General Assembly in Beijing has found the first group of galaxies that is just like ours, a rare sight in the local Universe.


This image shows one of the two ‘exact matches’ to the Milky Way system found in the survey. The larger galaxy, denoted GAMA202627, which is similar to the Milky Way clearly has two large companions off to the bottom left of the image. In this image bluer colours indicate hotter, younger, stars like many of those that are found in our galaxy. (Credit: Dr. Aaron Robotham, ICRAR/St Andrews using GAMA data)

The Milky Way is a fairly typical galaxy on its own, but when paired with its close neighbours — the Magellanic Clouds — it is very rare, and could have been one of a kind, until a survey of our local Universe found another two examples just like us.

Astronomer Dr Aaron Robotham, jointly from the University of Western Australia node of the International Centre for Radio Astronomy Research (ICRAR) and the University of St Andrews in Scotland, searched for groups of galaxies similar to ours in the most detailed map of the local Universe yet, the Galaxy and Mass Assembly survey (GAMA).

“We’ve never found another galaxy system like the Milky Way before, which is not surprising considering how hard they are to spot! It’s only recently become possible to do the type of analysis that lets us find similar groups,” says Dr Robotham.

“Everything had to come together at once: we needed telescopes good enough to detect not just galaxies but their faint companions, we needed to look at large sections of the sky, and most of all we needed to make sure no galaxies were missed in the survey”

Sophisticated simulations of how galaxies form don’t produce many examples similar to the Milky Way and its surrounds, predicting them to be quite a rare occurrence. Astronomers haven’t been able to tell just how rare until now, with the discovery of not just one but two exact matches amongst the hundreds of thousands of galaxies surveyed.

“We found about 3% of galaxies similar to the Milky Way have companion galaxies like the Magellanic Clouds, which is very rare indeed. In total we found 14 galaxy systems that are similar to ours, with two of those being an almost exact match,” says Dr Robotham.

The Milky Way is locked in a complex cosmic dance with its close companions the Large and Small Magellanic Clouds, which are clearly visible in the southern hemisphere night sky. Many galaxies have smaller galaxies in orbit around them, but few have two that are as large as the Magellanic Clouds.

Dr Robotham’s work also found that although companions like the Magellanic Clouds are rare, when they are found they’re usually near a galaxy very like the Milky Way, meaning we’re in just the right place at the right time to have such a great view in our night sky.

“The galaxy we live in is perfectly typical, but the nearby Magellenic Clouds are a rare, and possibly short-lived, occurrence. We should enjoy them whilst we can, they’ll only be around for a few billion more years,” adds Dr Robotham.

Dr Robotham and colleagues have been awarded further time on telescopes in New South Wales and Chile to study these Milky Way twin systems now that they’ve been found.

The Galaxy and Mass Assembly (GAMA) survey is an international collaboration led from ICRAR and the Australian Astronomical Observatory to map our local Universe in closer detail.

ICRAR is a joint venture between Curtin University and The University of Western Australia providing research excellence in the field of radio astronomy.

Read more…

Climate Change & Rising Seas

Earth Watch Report – Saturday August 25th, 2012

August 25, 2012 by desertrose

Climate Change

Drastic desertification: Researchers study Dead Sea climate past, finding dramatic results

Over the past 10,000 years, climate changes in the Dead Sea region have led to surprisingly swift desertification within mere decades. This is what researchers from the University of Bonn and their Israeli colleagues found when analyzing pollen in sediments and fluctuations in sea levels, calling the findings ‘dramatic.’ They are presented in the current issue of the international geosciences journal Quaternary Science Reviews, whose print version is published on 23 August.
The Dead Sea, a salt sea without an outlet, lies over 400 meters below sea level. Tourists like its high salt content because it increases their buoyancy. “For scientists, however, the Dead Sea is a popular archive that provides a diachronic view of its climate past,” says Prof. Dr. Thomas Litt from the Steinmann-Institute for Geology, Mineralogy and Paleontology at the University of Bonn. Using drilling cores from riparian lake sediments, paleontologists and meteorologists from the University of Bonn deduced the climate conditions of the past 10,000 years. This became possible because the Dead Sea level has sunk drastically over the past years, mostly because of increasing water withdrawals lowering the water supply. Oldest pollen analysis In collaboration with the GeoForschungsZentrum Potsdam (German Research Centre for Geosciences) and Israel’s Geological Service, the researchers took a 21 m long sediment sample in the oasis Ein Gedi at the west bank of the Dead Sea. They then matched the fossil pollen to indicator plants for different levels of precipitation and temperature. Radiocarbon-dating was used to determine the age of the layers. “This allowed us to reconstruct the climate of the entire postglacial era,” Prof. Litt reports. “This is the oldest pollen analysis that has been done on the Dead Sea to date.” In total, there were three different formations of vegetation around this salt sea. In moist phases, a lush, sclerophyll vegetation thrived as can be found today around the Mediterranean Sea. When the climate turned drier, steppe vegetation took over. Drier episodes yet were characterized by desert plants. The researchers found some rapid changes between moist and dry phases.
Transforming pollen data into climate information The pollen data allows inferring what kinds of plants were growing at the corresponding times. Meteorologists from the University of Bonn took this paleontological data and converted it into climate information. Using statistical methods, they matched plant species with statistical parameters regarding temperature and precipitation that determine whether a certain plant can occur. “This allows us to make statements on the probable climate that prevailed during a certain period of time within the catchment area of the Dead Sea,” reports Prof. Dr. Andreas Hense from the University of Bonn’s Meteorological Institute. The resilience of the resulting climate information was tested using the data on Dead Sea level fluctuations collected by their Israeli colleagues around Prof. Dr. Mordechai Stein from the Geological Services in Jerusalem. “The two independent data records corresponded very closely,” explains Prof. Litt. “In the moist phases that were determined based on pollen analysis, our Israeli colleagues found that water levels were indeed rising in the Dead Sea, while they fell during dry episodes.” This is plausible since the water level of a terminal lake without an outlet is exclusively determined by precipitation and evaporation. Droughts led to the biblical exodus According to the Bonn researchers’ data, there were distinct dry phases particularly during the pottery Neolithic (about 7,500 to 6,500 years ago), as well as at the transition from the late Bronze Age to the early Iron Age (about 3,200 years ago). “Humans were also strongly affected by these climate changes,” Prof. Litt summarizes the effects. The dry phases might have resulted in the Canaanites’ urban culture collapsing while nomads invaded their area. “At least, this is what the Old Testament refers to as the exodus of the Israelites to the Promised Land.” Dramatic results In addition, this look back allows developing scenarios for potential future trends. “Our results are dramatic; they indicate how vulnerable the Dead Sea ecosystems are,” says Prof. Litt. “They clearly show how surprisingly fast lush Mediterranean sclerophyll vegetation can morph into steppe or even desert vegetation within a few decades if it becomes drier.” Back then, the consequences in terms of agriculture and feeding the population were most likely devastating. The researchers want to probe even further back into the climate past of the region around the Dead Sea by drilling even deeper. More information: Holocene climate variability in the Levant from the Dead Sea pollen record, Quaternary Science Reviews 49 (August 2012), dx.doi.org/10.1016/j.quascirev.2012.06.012 Journal reference: Quaternary Science Reviews search and more info website Provided by University of Bonn search and more info website

Arctic cap on course for record melt: US scientists

by Shaun Tandon

Ice melts next to the village of Ny-Aalesundin Norway in 2009. The Arctic ice cap is melting at a startlingly rapid rate and may shrink to its smallest-ever level within weeks as the planet’s temperatures rise, US scientists said Tuesday. The Arctic ice cap is melting at a startlingly rapid rate and may shrink to its smallest-ever level within weeks as the planet’s temperatures rise, US scientists said Tuesday.
Researchers at the University of Colorado at Boulder said that the summer ice in the Arctic was already nearing its lowest level recorded, even though the summer melt season is not yet over. “The numbers are coming in and we are looking at them with a sense of amazement,” said Mark Serreze, director of the National Snow and Ice Data Center at the university. “If the melt were to just suddenly stop today, we would be at the third lowest in the satellite record. We’ve still got another two weeks of melt to go, so I think we’re very likely to set a new record,” he told AFP. The previous record was set in 2007 when the ice cap shrunk to 4.25 million square kilometers (1.64 million square miles), stunning scientists who had not forecast such a drastic melt so soon. The Colorado-based center said that one potential factor could be an Arctic cyclone earlier this month. However, Serreze played down the effects of the cyclone and said that this year’s melt was all the more remarkable because of the lack of special weather factors seen in 2007. Serreze said that the extensive melt was in line with the effects of global warming, with the ice being hit by a double whammy of rising temperatures in the atmosphere and warmer oceans. “The ice now is so thin in the spring just because of the general pattern of warming that large parts of the pack ice just can’t survive the summer melt season anymore,” he said. Russia’s Roshydromet environmental agency also reported earlier this month that the Arctic melt was reaching record levels. Several studies have predicted that the cap in the summer could melt completely in coming decades. The thaw in the Arctic is rapidly transforming the geopolitics of the region, with the long forbidding ocean looking more attractive to the shipping and energy industries.
Five nations surround the Arctic Ocean — Russia, which has about half of the coastline, along with Canada, Denmark, Norway and the United States — but the route could see a growing number of commercial players. The first ship from China — the Xuelong, or Snow Dragon — recently sailed from the Pacific to the Atlantic via the Arctic Ocean, cutting the distance by more than 40 percent. Egill Thor Nielsson, an Icelandic scientist who participated in the expedition, said last week in Reykjavik that he expected China to be increasingly interested in the route as it was relatively easy to sail. But the rapid melt affects local people’s lifestyles and scientists warn of serious consequences for the rest of the planet. The Arctic ice cap serves a vital function by reflecting light and hence keeping the earth cool. Serreze said it was possible that the rapid melt was a factor in severe storms witnessed in recent years in the United States and elsewhere as it changed the nature of the planet’s temperature gradients. The planet has charted a slew of record temperatures in recent years. In the continental United States, July was the hottest ever recorded with temperatures 3.3 degrees Fahrenheit (1.8 Celsius) higher than the average in the 20th century, according to the National Oceanic and Atmospheric Administration. Most scientists believe that carbon emissions from industry cause global warming. Efforts to control the gases have encountered resistance in a number of countries, with some lawmakers in the United States questioning the science.

************************************************************************************************************

Rising Seas

U.Va. institute assists Virginians with sea-level rise

 By Preston Pezzaro
Virginia’s largest city may get up to 45,000 acres smaller over the next century, due to an anticipated 2.3 to 5.2 feet of relative sea-level rise expected in Virginia Beach – a rise that would also impact the entire Hampton Roads region and the Eastern Shore.  Recognizing the challenges this will pose, the University of Virginia’s Institute for Environmental Negotiation is assisting citizens and decision-makers in long-range planning. Under director Frank Dukes, associate director Tanya Denckla Cobb and graduate associate Melissa Keywood – all from U.Va.’s School of Architecture – the institute is working to develop awareness of, and strategies to face, rising sea levels. Beginning in March 2011, the institute established partnerships with the Hampton Roads Planning District Commission, Wetlands Watch and the city of Virginia Beach to host four listening sessions for Hampton Roads and Eastern Shore citizens to share their experiences of sea-level rise and ideas for confronting it. Following these gatherings, the institute has been working with its partners to synthesize its findings and develop recommendations for action. Later this week, it will release a report on a May 9 session in Virginia Beach, at which the institute facilitated a meeting of a diverse group of 15 regional stakeholders. There, the project partners sorted through 56 potential policies and chose the five most important, and relevant, policy categories for Virginia Beach, discussing in detail the costs and benefits of each category. These included preparing educational materials, tools and online programs; the use of transfer or purchase of development rights; reasonable restrictions and rolling easements; special tax districts for improvements; and updating the zoning code to prepare buildings in vulnerable areas. “I feel strongly that planners need to play a pivotal role in helping communities prepare for these difficult challenges. However, this is not an issue we can address with traditional planning tools, like zoning, alone,” said Keywood, who developed the coastal listening sessions (for which she earned the National Oceanic and Atmospheric Administration’s Walter B. Jones Award for Excellence in Coastal and Ocean Management in June). Nearly 200 citizens and elected officials turned out June 13 for a Coastal Flooding Workshop in Melfa on Virginia’s Eastern Shore. Denckla Cobb, the project coordinator, said the turnout was “record-breaking,” and remarked on participants’ enthusiasm and desire for local government to boost its involvement in education and outreach regarding rising sea levels – a sentiment also heard in Virginia Beach.  A vast majority of the Melfa participants said they had noticed changes in wetlands and beaches, she said. “They know that rising sea levels are having real impacts, such as causing more frequent flooding during storm events. It’s also clear that people want more information, not just about what’s happening and why, but also about specific ways communities can prepare for sea-level rise.” “It was clear that people were very interested in catalyzing action to implement new policies to address this concern,” said Keywood, a graduate of the Architecture School’s master’s program in urban and environmental planning. According to a survey taken in Virginia Beach, people considered themselves fairly knowledgeable about sea-level rise and its potential consequences, ranging from wildlife habitat concerns to potential road blockages. “Participants in our workshops are very in tune with their local environments and are acutely aware of the changes they’ve observed over time in regards to habitat loss, shoreline erosion, business loss and others,” Keywood said. Nevertheless, Denckla Cobb saw that many were less aware of strategies and tools they could implement on an individual or local level – reinforcing the need for the institute to play a role in facilitating the development of practical solutions. Sea-level rise is a “multifaceted issue for which there are not a lot of practical, usable tools, unless political will changes,” she said, adding, “There is a difference between knowing what is needed and getting it done.” In addition to the efforts of the institute, Virginia Sea Grant has funded graduate student fieldwork in Hampton Roads as part of architecture professor Timothy Beatley’s “Climate Change and Coastal Planning” course. Its final report focuses on adaptation and accommodation as ways to mitigate sea-level rise, specifically through strategies of land use and growth management, resilience and knowledge dissemination. Since 1980, the Institute for Environmental Negotiation has worked throughout Virginia to mediate natural and man-made environmental issues, such as re-mediating coal mines, revitalizing tobacco farms and mitigating sea-level changes. For more on its Community Resilience in Coastal Virginia initiative, including the new focus group reports, visit its website. Provided by University of Virginia search and more info website
Read more…

Extreme Temperatures/ Weather / Drought & Storms

Earth Watch Report – Saturday August 25th, 2012

Extreme Temperatures/ Weather / Drought

Some scientists say that questions over whether man-made warming is disrupting the Earth’s climate are diminishing   Severely damaged corn stalks due to a widespread drought are seen at sunset on a farm near Oakland City, Indiana, August 15, 2012. Heatwaves, drought and floods that have struck the northern hemisphere for the third summer running are narrowing doubts that man-made warming is disrupting Earth’s climate system, say some scientists. Heatwaves, drought and floods that have struck the northern hemisphere for the third summer running are narrowing doubts that man-made warming is disrupting Earth’s climate system, say some scientists.
Climate experts as a group are reluctant to ascribe a single extreme event or season to global warming. Weather, they argue, has to be assessed over far longer periods to confirm a shift in the climate and whether natural factors or fossil-fuel emissions are the cause. But for some, such caution is easing. A lengthening string of brutal weather events is going hand in hand with record-breaking rises in temperatures and greenhouse-gas levels, an association so stark that it can no longer be dismissed as statistical coincidence, they say. “We prefer to look at average annual temperatures on a global scale, rather than extreme temperatures,” said Jean Jouzel, vice chairman of the UN’s Nobel-winning scientists, the Intergovernmental Panel on Climate Change (IPCC). Even so, according to computer models, “over the medium and long term, one of the clearest signs of climate change is a rise in the frequency of heatwaves”, he said. “Over the last 50 years, we have seen that as warming progresses, heatwaves are becoming more and more frequent,” Jouzel said. “If we don’t do anything, the risk of a heatwave occurring will be 10 times higher by 2100 compared with the start of the century.” The past three months have seen some extraordinary weather in the United States, Europe and East and Southeast Asia. The worst drought in more than 50 years hit the US Midwest breadbasket while forest fires stoked by fierce heat and dry undergrowth erupted in California, France, Greece, Italy, Croatia and Spain. Heavy rains flooded Manila and Beijing and China’s eastern coast was hit by an unprecedented three typhoons in a week.
Last month was the warmest ever recorded for land in the northern hemisphere and a record high for the contiguous United States, according to the US National Oceanic and Atmospheric Administration (NOAA). Globally, the temperature in July was the fourth highest since records began in 1880, it said. James Hansen, arguably the world’s most famous climate scientist (and a bogeyman to climate skeptics), contends the link between extreme heat events and global warming is now all but irrefutable. The evidence, he says, comes not from computer simulations but from weather observations themselves. In a study published this month in the peer-reviewed US journal Proceedings of the National Academy of Sciences (PNAS), Hansen and colleagues compared temperatures over the past three decades to a baseline of 1951-80, a period of relative stability. Over the last 30 years, there was 0.5-0.6 C (0.9-1.0 F) of warming, a rise that seems small but “is already having important effects”, said Hansen, director of NASA’s Goddard Institute for Space Studies. During the baseline period, cold summers occurred about a third of the time, but this fell to about 10 percent in the 30-year period that followed. Hot summers which during the baseline period occurred 33 percent of the time, rose to about 75 percent in the three decades that followed. Even more remarkable, though, was the geographical expansion of heatwaves. During the baseline period, an unusually hot summer would yield a heatwave that would cover just a few tenths of one percent of the world’s land area. Today, though, an above-the-norm summer causes heatwaves that in total affect about 10 percent of the land surface. “The extreme summer climate anomalies in Texas in 2011, in Moscow in 2010 and in France in 2003 almost certainly would not have occurred in the absence of global warming with its resulting shift of the anomaly situation,” says the paper. In March, an IPCC special report said there was mounting evidence of a shift in patterns of extreme events in some regions, including more intense and longer droughts and rainfall. But it saw no increases in the frequency, length or severity of tropical storms.
Today Forest / Wild Fire USA State of Alaska, [Dry Creek] Damage level Details

Forest / Wild Fire in USA on Saturday, 25 August, 2012 at 03:54 (03:54 AM) UTC.

Description
A wildfire burning on military land south of Fairbanks has grown to 42,000 acres, and smoke continues to cause hazy conditions. The Fairbanks Daily News-Miner reports the Dry Creek Fire is growing because of shifting winds. The fire was more than 28,000 acres on Thursday, and spread 14,000 acres throughout the day. The fire located on land co-managed by the U.S. Army and the Bureau of Land Management about 25 miles south of Fairbanks. Air quality advisories have been issued. The fire is not being actively fought since there’s no threat to people or resources. However, that could change if the fire jumps the Tanana River. The National Weather Service expects winds to shift the fire away from population centers on Friday, when rain could also suppress the fire.

UN agency calls for global action plan on drought

A Malian refugee pulls a jerry-can of water in Mauritania
A Malian refugee pulls a jerry-can of water in Mauritania Enlarge A Malian refugee pulls a jerrican of water at the Mbere refugee camp on May 3, 2012, near Bassiknou, southern Mauritania. The worst effects of drought could be avoided if countries had a disaster management plan to confront the problem, the UN World Meteorological Organization said Tuesday. The worst effects of drought could be avoided if countries had a disaster management plan to confront the problem, the UN World Meteorological Organization said Tuesday.
With world food prices 6 percent higher now than at the start of the year and approaching the 2010 record, “it’s time for countries affected by drought to move towards developing a policy”, said Mannava Sivakumar, director of the WMO’s Climate Prediction and Adaptation Branch. Such a global approach would also help counter the “major impact” of El Nino, said Sivakumar, in reference to the weather system credited with causing dry conditions in countries including Australia, India and much of east Africa, and flooding in Latin American countries. Initial forecasts for El Nino show that water temperatures in the Pacific are likely to be warmer than normal for September and October, he said, echoing recent Japanese meteorological research that the phenomenon is likely to last until winter in the northern hemisphere. “If it continues through the winter months there could be some consequences but we will carefully monitor (them),” said Sivakumar. Despite repeated droughts throughout human history and their long-term impact compared with other natural disasters, Australia is the only country in the world to develop a risk management policy for drought, Sivakumar said. “To fill the existing vacuum in virtually every nation (for drought management)” the WMO is to host a high-level meeting on national drought policies in Geneva next March, the UN agency said in a statement. Such measures would include better drought monitoring by countries, implementing early-warning systems and most importantly putting in place an “effective system to help the poorest of the poor”, Sivakumar said. Communicating the information to largely uneducated rural farming communities was essential, said Sivakumar, since this would enable them to avoid the worst effects of droughts by taking measures such as thinning crops to reduce the overall water requirement. This would ensure that they would have “some crop instead of no crop”, said Sivakumar.

***********************************************************************************************************

Storms 

Active tropical storm system(s)
Name of storm system Location Formed Last update Last category Course Wind Speed Gust Wave Source Details
Tembin (15W) Pacific Ocean 19.08.2012 25.08.2012 Typhoon II 260 ° 139 km/h 167 km/h 5.18 m JTWC Details

 Tropical Storm data

Share:
Storm name: Tembin (15W)
Area: Pacific Ocean
Start up location: N 17° 42.000, E 124° 36.000
Start up: 19th August 2012
Status: Active
Track long: 531.98 km
Top category.:
Report by: JTWC
Useful links:
Past track
Date Time Position Speed
km/h
Wind
km/h
Gust
km/h
Category Course Wave Pressure Source
19th Aug 2012 05:28:29 N 17° 42.000, E 124° 36.000 9 56 74 Tropical Depression 190 11 JTWC
19th Aug 2012 10:11:34 N 17° 30.000, E 124° 48.000 6 83 102 Tropical Storm 135 9 JTWC
20th Aug 2012 05:16:05 N 18° 0.000, E 124° 48.000 6 139 167 Typhoon I. 360 9 JTWC
20th Aug 2012 10:35:24 N 18° 24.000, E 124° 54.000 7 176 213 Typhoon II. 15 9 JTWC
21st Aug 2012 04:48:23 N 20° 12.000, E 125° 18.000 13 213 259 Typhoon IV. 360 15 JTWC
21st Aug 2012 10:41:18 N 21° 0.000, E 125° 24.000 15 204 250 Typhoon III. 5 16 JTWC
22nd Aug 2012 10:16:00 N 22° 30.000, E 124° 12.000 9 167 204 Typhoon II. 310 15 JTWC
23rd Aug 2012 04:49:56 N 22° 30.000, E 123° 36.000 4 204 232 Typhoon III. 270 9 JTWC
23rd Aug 2012 10:42:38 N 22° 42.000, E 123° 6.000 9 194 241 Typhoon III. 295 15 JTWC
24th Aug 2012 05:23:44 N 22° 6.000, E 120° 30.000 19 185 232 Typhoon III. 245 19 JTWC
24th Aug 2012 10:05:02 N 22° 18.000, E 119° 48.000 13 111 139 Tropical Storm 285 17 JTWC
Current position
Date Time Position Speed
km/h
Wind
km/h
Gust
km/h
Category Course Wave
feet
Pressure Source
25th Aug 2012 05:19:01 N 22° 24.000, E 118° 6.000 13 139 167 Typhoon II 260 ° 17 JTWC
Forecast track
Date Time Position Category Wind
km/h
Gust
km/h
Source
26th Aug 2012 12:00:00 N 20° 36.000, E 116° 54.000 Typhoon III 157 194 JTWC
26th Aug 2012 00:00:00 N 21° 12.000, E 116° 36.000 Typhoon III 148 185 JTWC
27th Aug 2012 00:00:00 N 20° 42.000, E 117° 54.000 Typhoon III 157 194 JTWC
28th Aug 2012 00:00:00 N 22° 42.000, E 120° 48.000 Typhoon II 139 167 JTWC
29th Aug 2012 00:00:00 N 25° 42.000, E 122° 24.000 Typhoon I 120 148 JTWC
30th Aug 2012 00:00:00 N 29° 0.000, E 123° 6.000 Typhoon I 102 130 JTWC
Bolaven (16W) Pacific Ocean 20.08.2012 25.08.2012 SuperTyphoon 325 ° 232 km/h 278 km/h 5.49 m JTWC Details

 Tropical Storm data

Share:
Storm name: Bolaven (16W)
Area: Pacific Ocean
Start up location: N 17° 18.000, E 141° 30.000
Start up: 20th August 2012
Status: Active
Track long: 743.39 km
Top category.:
Report by: JTWC
Useful links:
Past track
Date Time Position Speed
km/h
Wind
km/h
Gust
km/h
Category Course Wave Pressure Source
20th Aug 2012 05:13:46 N 17° 18.000, E 141° 30.000 13 56 74 Tropical Depression 330 12 JTWC
20th Aug 2012 10:34:54 N 17° 48.000, E 141° 24.000 11 65 83 Tropical Storm 330 16 JTWC
21st Aug 2012 04:47:46 N 18° 12.000, E 140° 30.000 9 93 120 Tropical Storm 295 10 JTWC
21st Aug 2012 10:38:01 N 18° 24.000, E 140° 24.000 7 102 130 Tropical Storm 285 11 JTWC
22nd Aug 2012 10:13:54 N 19° 12.000, E 138° 24.000 15 148 185 Typhoon I. 285 19 JTWC
23rd Aug 2012 04:49:02 N 19° 42.000, E 135° 36.000 9 167 204 Typhoon II. 280 10 JTWC
23rd Aug 2012 10:40:31 N 20° 0.000, E 135° 0.000 11 185 232 Typhoon III. 300 16 JTWC
24th Aug 2012 05:22:54 N 21° 0.000, E 133° 36.000 11 194 241 Typhoon III. 325 16 JTWC
24th Aug 2012 10:02:27 N 21° 42.000, E 133° 12.000 15 213 259 Typhoon IV. 330 18 JTWC
Current position
Date Time Position Speed
km/h
Wind
km/h
Gust
km/h
Category Course Wave
feet
Pressure Source
25th Aug 2012 05:16:28 N 23° 30.000, E 132° 6.000 15 232 278 SuperTyphoon 325 ° 18 JTWC
Forecast track
Date Time Position Category Wind
km/h
Gust
km/h
Source
26th Aug 2012 00:00:00 N 25° 42.000, E 129° 24.000 SuperTyphoon 250 306 JTWC
26th Aug 2012 12:00:00 N 26° 54.000, E 127° 54.000 SuperTyphoon 241 296 JTWC
27th Aug 2012 00:00:00 N 28° 36.000, E 126° 48.000 SuperTyphoon 232 278 JTWC
28th Aug 2012 00:00:00 N 34° 54.000, E 125° 24.000 Typhoon IV 194 241 JTWC
29th Aug 2012 00:00:00 N 43° 12.000, E 127° 18.000 Typhoon I 102 130 JTWC
30th Aug 2012 00:00:00 N 50° 18.000, E 135° 30.000 Tropical Depression 56 74 JTWC
Isaac (AL09) Atlantic Ocean 21.08.2012 25.08.2012 Hurricane I 310 ° 111 km/h 139 km/h 4.57 m NOAA NHC Details

Tropical Storm data

Share:
Storm name: Isaac (AL09)
Area: Atlantic Ocean
Start up location: N 15° 12.000, W 51° 12.000
Start up: 21st August 2012
Status: Active
Track long: 1,421.34 km
Top category.:
Report by: NOAA NHC
Useful links:
Past track
Date Time Position Speed
km/h
Wind
km/h
Gust
km/h
Category Course Wave Pressure Source
21st Aug 2012 10:45:53 N 15° 12.000, W 51° 12.000 31 56 74 Tropical Depression 270 12 1007 MB NOAA NHC
22nd Aug 2012 04:54:04 N 15° 36.000, W 55° 36.000 30 65 83 Tropical Storm 275 16 1006 MB NOAA NHC
22nd Aug 2012 11:01:55 N 15° 30.000, W 57° 18.000 30 74 93 Tropical Storm 270 19 1003 MB NOAA NHC
23rd Aug 2012 05:06:43 N 15° 48.000, W 63° 0.000 31 74 93 Tropical Storm 270 22 1003 MB NOAA NHC
24th Aug 2012 05:17:31 N 16° 42.000, W 68° 42.000 28 74 93 Tropical Storm 290 19 1001 MB NOAA NHC
24th Aug 2012 11:15:35 N 16° 6.000, W 70° 0.000 24 74 93 Tropical Storm 275 19 1000 MB NOAA NHC
Current position
Date Time Position Speed
km/h
Wind
km/h
Gust
km/h
Category Course Wave
feet
Pressure Source
25th Aug 2012 05:21:33 N 17° 42.000, W 72° 30.000 22 111 139 Hurricane I 310 ° 15 990 MB NOAA NHC
Forecast track
Date Time Position Category Wind
km/h
Gust
km/h
Source
26th Aug 2012 12:00:00 N 23° 24.000, W 79° 24.000 Hurricane I 102 120 NOAA NHC
26th Aug 2012 00:00:00 N 21° 42.000, W 76° 42.000 Tropical Depression 93 111 NOAA NHC
27th Aug 2012 00:00:00 N 24° 54.000, W 81° 36.000 Hurricane I 111 139 NOAA NHC
28th Aug 2012 00:00:00 N 27° 6.000, W 84° 36.000 Hurricane II 130 157 NOAA NHC
29th Aug 2012 00:00:00 N 30° 0.000, W 86° 30.000 Hurricane III 148 185 NOAA NHC
30th Aug 2012 00:00:00 N 32° 30.000, W 86° 30.000 Tropical Depression 74 93 NOAA NHC

NASA sees an active tropical Atlantic again

by Staff Writers
Greenbelt MD (SPX)


This NOAA GOES-13 satellite image taken on Aug. 21 at 7:45 a.m. EDT shows three of the four tropical systems being watched in the Atlantic Ocean basin. From left to right are: System 95L, Tropical Depression 9 and System 96L. Post-tropical Storm Gordon is just beyond the horizon. Credit: NASA/NOAA GOES Project.

The Atlantic Ocean is kicking into high gear with low pressure areas that have a chance at becoming tropical depressions, storms and hurricanes. Satellite imagery from NASA’s Terra and Aqua satellites have provided visible, infrared and microwave data on four low pressure areas. In addition, NASA’s GOES Project has been producing imagery of all systems using NOAA’s GOES-13 satellite to see post-Tropical Storm Gordon, Tropical Depression 9, and Systems 95L and 96L.

Tropical Storm Gordon is no longer a tropical storm and is fizzling out east of the Azores. Tropical Depression 9 was born on Aug. 20 and continues to get organized. Behind Tropical Depression 9 in the eastern Atlantic is another low pressure area called System 96L. In the Gulf of Mexico lies another low, called System 95L.

In an image taken from NOAA’s GOES-13 satellite on Aug. 21 at 7:45 a.m. EDT, all of the systems were visible except for post-tropical Storm Gordon. The storms are seen lined up along the Atlantic basin from left to right with System 95L in the Gulf of Mexico, Tropical Depression 9 just east of the Caribbean Sea and System 96L in the eastern Atlantic Ocean.

NOAA manages the GOES-13 satellite, and NASA’s GOES Project uses the data to create images and animations out of NASA’s Goddard Space Flight Center in Greenbelt, Md.

Tropical Depression 9
On Aug. 20 at 0435 UTC (12:35 a.m. EDT) before System 94L organized into Tropical Storm 9, NASA’s Aqua satellite passed overhead, and the Atmospheric Infrared Sounder (AIRS) instrument captured an infrared image of the storm.

It showed that the strongest convection (rising air that forms the thunderstorms that make up the tropical cyclone) were located south of the center of circulation.

Those thunderstorms had cold cloud top temperatures of -63 Fahrenheit (-52 Celsius) that indicated there was strong uplift in the low pressure area, and were an indication that the system could strengthen, which it did later into a depression.

Tropical Depression 9 has been the cause for tropical storm warning posts in a number of islands. On Aug. 21, a Tropical Storm Warning is in effect for Dominica, Guadeloupe, Desirade, Les Saintes, Marie Galante, and St. Martin.

TD9 appears as a rounded storm on the GOES-13 satellite image from Aug. 21. In the image, low pressure area “System 96L” trails to the southwest of TD9.

On Aug. 21 at 8 a.m. EDT (1200 UTC) Tropical Depression 9 (TD9) had maximum sustained winds near 35 mph (55 kmh) and is expected to strengthen into a tropical storm later [today]. It was located about 645 miles (1,035 km) east of Guadeloupe near latitude 15.1 north and longitude 51.8 west. TD90 is moving toward the west near 20 mph (32 kmh) and is expected to continue moving in that direction for the next couple of days, according to the National Hurricane Center (NHC).

NHC said that the cyclone should move through the central Lesser Antilles on Wed., Aug. 22 and move into the Caribbean Sea the next day. NHC expects rainfall between 4 and 8 inches to affect the northern Windward and the Leeward Islands, accompanied by heavy surf and rip tides. System 96L in Eastern Atlantic

System 96L appears well-defined on the GOES-13 satellite imagery. It is associated with a tropical wave, and is spinning about 425 miles southwest of the Cape Verde Islands. The NHC said that System 96L could very well become the tenth tropical depression of the Atlantic Hurricane Season in the next day or two. It is moving to the west at 15 mph.

System 95L Struggles in the Gulf of Mexico
The eastern-most low pressure area in the Atlantic Ocean basin is System 95L, located in the western Gulf of Mexico. It is producing disorganized showers and thunderstorms just off-shore of the northeastern coast of Mexico. The low-level center of circulation is also elongated, which is a bad sign for a tropical cyclone trying to organize. Tropical cyclones need a strong, rounded circulation to strengthen.

The NHC noted that slow development is still possible before System 95L moves inland in northeastern Mexico later in the day on Wed. Aug 21. The system has a 30 percent chance of developing before that happens. Once inland, its chances for development are greatly reduced because it will be cut off from its life-giving warm water supply.

Tropical Storm Gordon is History
On Monday, August 20, satellite imagery and surface data revealed that Tropical Storm Gordon lost his tropical characteristics, making it a post-tropical cyclone. According to Reuters news, Gordon caused some power outages, fallen trees and minor flooding.

The National Hurricane Center issued their final advisory on Gordon on August 20 at 5 p.m. EDT (2100 UTC). At that time, Gordon still had maximum sustained winds near 45 mph (75 kmh) and was weakening.

Gordon was about 370 miles (595 km) east-northeast of the Azores, near latitude 39.2 north and longitude 20.3 west. Gordon was moving east-northeast near 16 mph (26 kmh) and was expected to turn southeast while weakening further. Gordon is expected to dissipate in a couple of days east of Portugal.

Related Links
NASA/Goddard Space Flight Center
Bringing Order To A World Of Disasters
When the Earth Quakes
A world of storm and tempest

Read more…

Earthquakes & Volcanic Activity

Earth Watch Report – Saturday August 25th, 2012

Earthquakes

RSOE EDIS

Date/Time (UTC) Magnitude Area Country State/Prov./Gov. Location Risk Source Details
25.08.2012 10:45:36 2.9 North America United States California Cobb There are volcano(s) nearby the epicenter. VulkĂĄn 0 VulkĂĄn 0 USGS-RSOE Details
25.08.2012 10:50:23 2.3 Europe Italy Calabria Salerni VulkĂĄn 0 VulkĂĄn 0 VulkĂĄn 0 EMSC Details
25.08.2012 10:35:34 2.1 North America United States Alaska Sterling VulkĂĄn 0 VulkĂĄn 0 VulkĂĄn 0 USGS-RSOE Details
25.08.2012 10:50:47 2.4 Europe Italy Calabria Salerni VulkĂĄn 0 VulkĂĄn 0 VulkĂĄn 0 EMSC Details
25.08.2012 10:40:33 3.4 Caribbean British Virgin Islands Road Town VulkĂĄn 0 VulkĂĄn 0 VulkĂĄn 0 USGS-RSOE Details
25.08.2012 09:50:19 4.1 Asia Turkey Manisa Golmarmara There are volcano(s) nearby the epicenter. There are airport(s) nearby the epicenter. VulkĂĄn 0 EMSC Details
25.08.2012 09:20:57 2.3 North America United States California Big Bear Lake There are volcano(s) nearby the epicenter. There are airport(s) nearby the epicenter. VulkĂĄn 0 USGS-RSOE Details
25.08.2012 10:00:30 4.0 Caribbean British Virgin Islands Road Town VulkĂĄn 0 VulkĂĄn 0 VulkĂĄn 0 USGS-RSOE Details
25.08.2012 10:51:10 4.0 Caribbean Sea British Virgin Islands Road Town VulkĂĄn 0 VulkĂĄn 0 VulkĂĄn 0 EMSC Details
25.08.2012 10:52:02 3.9 Caribbean British Virgin Islands Road Town VulkĂĄn 0 VulkĂĄn 0 VulkĂĄn 0 USGS-RSOE Details
25.08.2012 08:52:29 2.3 North America United States California Saratoga VulkĂĄn 0 There are airport(s) nearby the epicenter. VulkĂĄn 0 USGS-RSOE Details
25.08.2012 08:30:56 2.8 North America United States Utah Big Water There are volcano(s) nearby the epicenter. VulkĂĄn 0 VulkĂĄn 0 USGS-RSOE Details
25.08.2012 08:50:20 3.8 Europe Greece Central Greece Roviai VulkĂĄn 0 There are airport(s) nearby the epicenter. VulkĂĄn 0 EMSC Details
25.08.2012 08:50:51 2.9 Europe Greece Crete Kissamos VulkĂĄn 0 There are airport(s) nearby the epicenter. VulkĂĄn 0 EMSC Details
25.08.2012 08:51:34 2.4 Europe Bosnia and Herzegovina Federation of Bosnia and Herzegovina Vitez VulkĂĄn 0 There are airport(s) nearby the epicenter. VulkĂĄn 0 EMSC Details
25.08.2012 07:50:18 2.4 Europe Greece North Aegean Mithymna VulkĂĄn 0 There are airport(s) nearby the epicenter. VulkĂĄn 0 EMSC Details
25.08.2012 06:45:26 3.1 South-America Chile Región Metropolitana La Pintana There are volcano(s) nearby the epicenter. There are airport(s) nearby the epicenter. VulkĂĄn 0 EMSC Details
25.08.2012 05:55:33 2.8 North America United States California Avalon VulkĂĄn 0 VulkĂĄn 0 VulkĂĄn 0 USGS-RSOE Details
25.08.2012 07:50:43 2.3 Asia Turkey Amasya Dedekoy VulkĂĄn 0 VulkĂĄn 0 VulkĂĄn 0 EMSC Details
25.08.2012 07:51:04 3.8 Europe Russia Tyva Sukpak VulkĂĄn 0 VulkĂĄn 0 VulkĂĄn 0 EMSC Details
25.08.2012 07:51:25 2.6 Asia Turkey Antalya Kalkan VulkĂĄn 0 VulkĂĄn 0 VulkĂĄn 0 EMSC Details
25.08.2012 05:50:28 4.4 Pacific Ocean – West Vanuatu Torba Sola VulkĂĄn 0 VulkĂĄn 0 VulkĂĄn 0 USGS-RSOE Details
25.08.2012 06:45:45 4.4 Pacific Ocean – West Vanuatu Torba Sola VulkĂĄn 0 VulkĂĄn 0 VulkĂĄn 0 EMSC Details
25.08.2012 06:46:03 2.8 Asia Turkey Amasya Dedekoy VulkĂĄn 0 VulkĂĄn 0 VulkĂĄn 0 EMSC Details
25.08.2012 05:40:37 2.8 Asia Turkey Amasya Dedekoy VulkĂĄn 0 VulkĂĄn 0 VulkĂĄn 0 EMSC Details
25.08.2012 06:46:22 2.2 Asia Turkey Amasya Dedekoy VulkĂĄn 0 VulkĂĄn 0 VulkĂĄn 0 EMSC Details
25.08.2012 04:56:05 2.5 North America United States California Indianola VulkĂĄn 0 VulkĂĄn 0 VulkĂĄn 0 USGS-RSOE Details
25.08.2012 05:41:44 3.1 Europe Greece Crete Yialos VulkĂĄn 0 There are airport(s) nearby the epicenter. VulkĂĄn 0 EMSC Details
25.08.2012 04:40:50 2.3 North America United States Alaska Petersville VulkĂĄn 0 VulkĂĄn 0 VulkĂĄn 0 USGS-RSOE Details
25.08.2012 04:40:21 2.5 Europe Italy Sicily Saponara Villafranca There are volcano(s) nearby the epicenter. There are airport(s) nearby the epicenter. VulkĂĄn 0 EMSC Details
25.08.2012 03:40:20 2.7 Europe Romania Mehedin?i Svinita VulkĂĄn 0 VulkĂĄn 0 VulkĂĄn 0 EMSC Details
25.08.2012 03:40:44 3.5 Europe Greece Peloponnese Elafonisos VulkĂĄn 0 There are airport(s) nearby the epicenter. VulkĂĄn 0 EMSC Details
25.08.2012 02:45:55 3.1 Caribbean U.S. Virgin Islands Saint Thomas Island Charlotte Amalie VulkĂĄn 0 VulkĂĄn 0 VulkĂĄn 0 USGS-RSOE Details
25.08.2012 03:41:10 4.1 Africa Algeria Chlef Sidi Akkacha VulkĂĄn 0 There are airport(s) nearby the epicenter. VulkĂĄn 0 EMSC Details
25.08.2012 01:16:21 2.1 North America United States California Big Bear City There are volcano(s) nearby the epicenter. There are airport(s) nearby the epicenter. VulkĂĄn 0 USGS-RSOE Details
25.08.2012 06:16:00 2.2 North America United States Oregon Paisley VulkĂĄn 0 VulkĂĄn 0 VulkĂĄn 0 USGS-RSOE Details
25.08.2012 01:40:18 4.6 Indonesian Archipelago Indonesia Bengkulu Curup VulkĂĄn 0 VulkĂĄn 0 VulkĂĄn 0 EMSC Details
25.08.2012 01:41:38 4.7 Indonesian archipelago Indonesia Bengkulu Curup VulkĂĄn 0 VulkĂĄn 0 VulkĂĄn 0 USGS-RSOE Details
25.08.2012 01:40:46 2.4 Europe Italy Calabria Nicastro There are volcano(s) nearby the epicenter. There are airport(s) nearby the epicenter. VulkĂĄn 0 EMSC Details
25.08.2012 01:41:11 4.4 South-America Chile Valparaíso San Antonio VulkĂĄn 0 VulkĂĄn 0 VulkĂĄn 0 EMSC Details
25.08.2012 00:50:57 4.7 South America Chile Valparaíso San Antonio VulkĂĄn 0 VulkĂĄn 0 VulkĂĄn 0 USGS-RSOE Details
25.08.2012 00:35:26 2.4 Europe Italy Abruzzo Balsorano Vecchio VulkĂĄn 0 There are airport(s) nearby the epicenter. VulkĂĄn 0 EMSC Details
25.08.2012 00:35:51 3.0 Europe Greece North Aegean Agia Paraskevi VulkĂĄn 0 There are airport(s) nearby the epicenter. VulkĂĄn 0 EMSC Details
25.08.2012 00:36:13 2.0 Europe Italy Lombardy Ospitaletto VulkĂĄn 0 There are airport(s) nearby the epicenter. VulkĂĄn 0 EMSC Details
25.08.2012 00:05:27 3.9 North America United States Alaska Healy There are volcano(s) nearby the epicenter. VulkĂĄn 0 VulkĂĄn 0 USGS-RSOE Details
25.08.2012 00:36:34 4.7 Indonesian Archipelago Indonesia Aceh Meulaboh VulkĂĄn 0 VulkĂĄn 0 VulkĂĄn 0 EMSC Details
25.08.2012 00:10:26 4.7 Indonesian archipelago Indonesia Aceh Meulaboh VulkĂĄn 0 VulkĂĄn 0 VulkĂĄn 0 USGS-RSOE Details
25.08.2012 00:36:55 2.6 Europe Italy Emilia-Romagna San Prospero VulkĂĄn 0 There are airport(s) nearby the epicenter. VulkĂĄn 0 EMSC Details
25.08.2012 06:46:42 2.0 Asia Turkey Van Toyga There are volcano(s) nearby the epicenter. There are airport(s) nearby the epicenter. VulkĂĄn 0 EMSC Details
25.08.2012 00:37:17 2.7 Asia Turkey Afyonkarahisar Kiziloren VulkĂĄn 0 There are airport(s) nearby the epicenter. VulkĂĄn 0 EMSC Details

…………………………………………….

Four quakes rock Nepal in past 12 hours

National Seismological Centre has its stations across the country.

KESHAV P. KOIRALA

KATHMANDU: Four consecutive earthquakes — two of them powerful ones — rocked western Nepal in past 12 hours.

With their epicentres in the border area of Rolpa and Rukum districts, the tremors of the first quake were felt in Kathmandu at 10:15 pm last night.

Its magnitude was 5.6 on the Richter Scale, according to Dilli Ram Tiwari, survey officer at National Seismological Centre (NSC) in Kathmandu.

The second quake was measured at 10:27 pm yesterday, and it was 4.4 in magnitude.

The NSC has recorded two earthquakes this morning also.

The quakes at 6:02 am and 9.40 am were 4.4 and 5.2 on the Richter Scale, Tiwari said.

It is yet to learn whether the quakes caused any damage in the areas near epicentre.

Courtesy: National Seismological Centre, Lainchaur

Antarctic Ice Sheet Quakes Shed Light On Ice Movement and Earthquakes

ScienceDaily

Analysis of small, repeating earthquakes in an Antarctic ice sheet may not only lead to an understanding of glacial movement, but may also shed light on stick slip earthquakes like those on the San Andreas fault or in Haiti, according to Penn State geoscientists.


Analysis of small, repeating earthquakes in an Antarctic ice sheet may not only lead to an understanding of glacial movement, but may also shed light on stick slip earthquakes like those on the San Andreas fault or in Haiti, according to Penn State geoscientists. (Credit: © Achim Baqué / Fotolia)

“No one has ever seen anything with such regularity,” said Lucas K. Zoet, recent Penn State Ph. D. recipient, now a postdoctoral fellow at Iowa State University. “An earthquake every 25 minutes for a year.”

The researchers looked at seismic activity recorded during the Transantarctic Mountains Seismic Experiment from 2002 to 2003 on the David Glacier in Antarctica, coupled with data from the Global Seismic Network station Vanda. They found that the local earthquakes on the David Glacier, about 20,000 identified, were predominantly the same and occurred every 25 minutes give or take five minutes.

The researchers note in the current Nature Geoscience that, “The remarkable similarity of the waveforms … indicates that they share the same source location and source mechanisms.” They suggest that “the same subglacial asperity repeatedly ruptures in response to steady loading from the overlying ice, which is modulated by stress from the tide at the glacier front.”

“Our leading idea is that part of the bedrock is poking through the ductile till layer beneath the glacier,” said Zoet.

The researchers have determined that the asperity — or hill — is about a half mile in diameter.

The glacier, passing over the hill, creates a stick slip situation much like that on the San Andreas fault. The ice sticks on the hill and stress gradually builds until the energy behind the obstruction is high enough to move the ice forward. The ice moves in a step-by-step manner rather than smoothly.

But motion toward the sea is not the only thing acting on the ice streaming from David glacier. Like most glaciers near oceans, the edge of the ice floats out over the water and the floating ice is subject to the action of tides.

“When the tide comes in it pushes back on the ice, making the time between slips slightly longer,” said Sridhar Anandakrishnan, professor of geoscience. “When the tide goes out, the time between slips decreases.”

However, the researchers note that the tides are acting at the ground line, a long way from the location of the asperity and therefore the effects that shorten or lengthen the stick slip cycle are delayed.

“This was something we didn’t expect to see,” said Richard B. Alley, Evan Pugh Professor of Geosciences. “Seeing it is making us reevaluate the basics.”

He also noted that these glacial earthquakes, besides helping glaciologists understand the way ice moves, can provide a simple model for the stick slip earthquakes that occur between landmasses.

“We have not completely explained how ice sheets flow unless we can reproduce this effect,” said Alley. “We can use this as a probe and look into the physics so we better understand how glaciers move.”

Before 2002, this area of the David glacier flowed smoothly, but then for nearly a year the 20-minute earthquake intervals occurred and then stopped. Something occurred at the base of the ice to start and then stop these earthquakes.

“The best idea we have is that during those 300 days, a dirty patch of ice was in contact with the mount, changing the way stress was transferred,” said Zoet. “The glacier is experiencing earthquakes again, although at a different rate. It would be nice to study that.”

Unfortunately, the seismographic instruments that were on the glacier in 2002 no longer exist, and information is coming from only one source at the moment.

Tectonic Shoving Match Formed Caribbean Island Arc

OurAmazingPlanet Staff

The image shows how the Caribbean plate is pushed to the east relative to the South American plate, causing the Caribbean Islands' distinctive arc shape.
The image shows how the Caribbean plate is pushed to the east relative to the South American plate, causing the Caribbean Islands’ distinctive arc shape.
CREDIT: Courtesy of Meghan Miller and Thorsten Becker

The movement of Earth’s viscous mantle against South America has pushed the Caribbean islands east over the last 50 million years, according to a study published Monday (Aug. 20) in the journal Nature Geoscience.

The University of Southern California, in announcing the study, said the findings upend previous hypotheses of the seismic activity beneath the Caribbean Sea and provide an important new look at the unique tectonic interactions that are causing the Caribbean plate to tear away from South America.

The Caribbean plate is being pushed eastward due to a thick section of the South American plate called a “cratonic keel.” This section of crust is three times

Meanwhile, part of the South American plate is being pushed beneath the Caribbean plate, a process called subduction. Intense heat and pressure gradually force water-containing magma to rise into the Earth’s mantle and fuel the many active volcanoes in the region.

All of this pushing and pulling formed the distinctive arc shape of the Caribbean islands and has created a very complex system of faults between the two plates, in northern South America, according to the USC statement. The study mapped several of these strike-slip faults, which are similar to California’s San Andreas Fault.

Recent earthquakes in the area helped the two researchers develop an image of the Earth’s deep interior. The earthquake waves move slower or quicker depending on the temperature and composition of the rock.

“Studying the deep earth interior provides insights into how the Earth has evolved into its present form,” researcher Meghan S. Miller said in the statement.

For their study, the researchers used earthquake data to develop 176 computer models, USC said

**********************************************************************************************************

Volcanic Activity

Volcano activity of August 23-24, 2012 – Mt. Tongariro, Sotara, Shiveluch, Karymsky, Santiaguito, Fuego, Sakurajima, Batu Tara, Tungurahua, Kilauea and Nevado del Ruiz

By Richard Wilson and Armand Vervaeck

August , 2012 volcano activity

Mount Tongariro volcano (New Zealand) showed some seismicity earlier today (see seismogram below). The activity can only be seen in Oturere and West Tongariro seismograms (close to the Te Maari craters). Below also one of the rara clear view images of Mt. Tongariro with a strongly steaming vent. N report from GNS science about the seismicity however.  The Park service has announced that the trekking trails at Mount Tongariro would be reopened. A 3 km hazard and risk zone will remain in place for some time and might be further reduced once new information of the gas and ash composition is known.

Mt. Tongariro activity zone on one of these few clear moments since August 6 - Image courtesy Geonet and GNS Science

According to INGEOMINAS, the Observatorio Vulcanológico and Sismológico de Popayán reported that during 8-14 August seismic activity at Sotará increased. The seismic network recorded 110 magnitude 0.2-1.6 events mainly located in an area 0.1-5 km NE of the peak, at depths of 2-6 km. Inflation was detected in the NE area, coincident with the zone of increased seismicity. Web-camera views showed no morphological changes. The Alert Level was raised to III (Yellow; “changes in the behavior of volcanic activity”), or the second lowest level. (Smithsonian Institute)

KVERT reported moderate seismic activity from Karymsky during 10-20 August. Satellite imagery showed a weak thermal anomaly on the volcano during 10-13, 15, and 18-20 August. The Aviation Color Code remained at Orange.

KVERT reported that during 10-18 August weak seismic activity was detected at Shiveluch. Observers noted gas-and-steam activity during 15-17 August; weather conditions prevented observations of the volcano on the other days. Satellite imagery showed a thermal anomaly on the lava dome during 10, 12-13, and 18-19 August. Seismic activity increased to moderate levels and hot avalanches were observed during 19-20 August. The Aviation Color Code remained at Orange.

Insivumeh reports 2 moderate explosions at Santiaguito (Santa Maria), Guatemala. The other Guatemala volcano, Fuego sends a white plume approx. 50 meter in the air and grumbles every 1 to 3 minutes. See also seismograms from both volcanoes.

Activity observed by satellites
VAAC reports still the same volcanoes which can be dangerous for aviation ; Sakurajima, Batu Tara and a very active Tungurahua

SO2 satellite imagery shows SO2 clouds at the following volcanoes : Etna, Kilauea and Nevado del Ruiz. Clouds of a number of other volcanoes are not defined enough to be sure.

A smoking Nevado del Ruiz yesterday – image courtesy Ingeominas Colombia

Read more…

14 DAYS OF GLOBAL CATACLYSM AUGUST 2012

Published on Aug 16, 2012 by fidockave213

Note this video does not imply the world is going to end in 2012......
EXTREME WEATHER and EARTHCHANGES......EARTHQUAKES SINKHOLES FLOODS DROUGHT SNOW ANIMAL KILLS ETC
14 DAYS OF GLOBAL CATACLYSM AUGUST 2012

credit - Glacier footage - https://www.youtube.com/user/Barbecueengineer


The  latter  half  of  August

Fireballs impacting the ground

Honduras Investigates Alleged Meteorite Crash

Large meteorites found after fireball lands in Manitoba, Canada

Meteorite starts fire in Itatiba, Brazil following separate Fireball incident in neighbouring Campinas days earlier

Meteorite hits moving car in Sioux City

More strange sky sounds

More strange sky sounds, Sao Paulo, Brazil

Strange Sounds Over Suffern, New York

Strange Sounds in Germany

Multiple tornadoes/waterspouts

Nine waterspouts spotted on Lake Michigan

Multiple waterspouts touch down in Black Sea, near Foros, Ukraine

Multiple waterspouts touch down off Polish coast

Unusual lightning strikes

Lightning kills two brothers in Russia's Kursk region

3 Lightning strike survivors on Mt Whitney, CA: 'We thought we were on fire'

Lightning injures 10 New Jersey soldiers at New York's Ft. Drum

Lightning-sparked huge fire burns to edge of 3 small California towns

Authorities ID Wisconsin boy killed in lightning strike

Increase in Lightning Observed Across Japan... What the Hell Is That?!

Five seriously injured in French lightning strike

Lightning Strike Kills Wisconsin Boy, 9, and Injures Seven Others on Sailboat

Read more…

On the heels of the strange report and video posted last week of an 'Alien' looking creature shot dead in South Africa  - another odd one surfaces today. 

From the Hopi Prophecy

“There will be many strange beasts upon the Earth in those days, some from the past and some that we have never seen. . The nature of mankind will appear strange in these times we walk between worlds and we will house many spirits even within our bodies  After a time we will again walk with our brothers from the Stars, and rebuild this Earth But not until the Purifier has left his mark upon the universe.:


 Giant 'Gorgakh' killed in Pakistan

 Pakistan Creature: Source)

An amazing photo was posted to YouTube on Thursday of a strange, alien-like creature, locally called a "Gorgakh", and killed by villagers in Swabi, Pakistan.

The reason for all the amazement is because the creature is so unusually large. Some speculate it is a giant version of a Pangolin, an anteater or armadillo, found on the African continent.

But those animals generally don't grow beyond three feet in length. The one in the photo is as big as a full-grown man and twice as wide.

Naturally, many people are calling it an alien. That's because it bears an uncanny resemblance to the monster in the Alien movie franchise. It's got a scaly coat, a gigantic, droopy head with a long snout and thick legs with immense claws.

Locals in Pakistan are claiming the creature is responsible for digging up and eating dead bodies and possesses supernatural abilities. Perhaps that's why they killed it.

(South African Creature: Source)

Locals came across this strange creature while they were escorting a shooting party in Namibia. Witness’s state that the creature was spotted apparently foraging for food, one of the shooting party wounded it with his rifle and it escaped into the thick brush. The locals tracked it to a nearby lair or nest where they found three more creatures of similar size. The wounded creature attacked one of the shooting party and it was shot dead, the others escaped into the brush. The body of the creature was taken back to the local camp, police later removed its corpse and a full forensics investigation is under way. A video is pending on this so I will post if and when I receive it. So what is this guys, an Alien, Goblin, maybe a new species of pigmy or something more sinister, as always you decide.


Read more…

Politics, Legislation and Economy News

Government Overreach  :  Corruption

‘Fast and Furious’ ATF Official Granted Paid Leave to Take 6-Figure Job at JP Morgan

IssaRep. Darrell Issa (R-Calif.), chairman of the House Oversigh and Government Reform Committee (AP Photo)

(CNSNews.com) – The long-awaited inspector general’s report on the Justice Department’s botched gun-running scheme is finished, Rep. Darrell Issa (R-Calif.) said on Wednesday.

But along with that news comes more questions: Issa and Sen. Chuck Grassley (R-Iowa) are demanding to know why a top ATF official involved in Operation Fast and Furious remains on paid leave from ATF — while simultaneously drawing a six-figure salary from J.P. Morgan, a major investment bank.

In a letter to the acting head of the Bureau of Alcohol, Tobacco, Firearms and Explosives, Issa and Grassley asked why the Justice Department would approve such a special arrangement for Bill McMahon.

“Under any reading of the relevant personnel regulations, it appears that ATF management was under no obligation to approve this sort of arrangement,” wrote Issa and Grassley. “Given McMahon’s outsized role in the Fast and Furious scandal, the decision to approve an extended annual leave arrangement in order to attain pension eligibility and facilitate full-time, outside employment while still collecting a full-time salary at ATF raises a host of questions about both the propriety of the arrangement and the judgment of ATF management.”

Issa and Grassley say the ATF has made it possible for McMahon to “double dip for nearly half a year by receiving two full-time paychecks — one from the taxpayer and one from the private sector.”

They  noted that the treatment of McMahon is “in sharp contrast” to how the ATF has treated whistleblowers such as Special Agent John Dodson, “who is told he must wait until the Inspector General’s report is complete before the agency will even consider his simple request for a statement retracting the false statements made about him by agency leadership.”

Issa and Grassley noted that ATF approved the arrangement for McMahom before the Justice Department inspector general finished his report on the failed gun tracking scheme.

As for the IG report examining Fast and Furious, as well as the Justice Department’s knowledge of and response to it, Issa said the report is done:

“We know that the IG report is finished, we know that it’s at Justice, and we know that we can’t see it. We’re hoping, though, that they will release it,” Issa told Fox News’s Greta Van Susteren on Wednesday.

Issa said he’s “positive” that the IG’s report “is going to say the same thing our report has said, which is — this is somebody (Bill McMahon) who is responsible for and signed documents that he told our committee he didn’t see, didn’t know about. Now, the only question is — did he not read them and sign them?”

“We’re dealing with somebody who should have been fired from ATF,” Issa added.

According to the final congressional report on Fast and Furious, William McMahon was a supervisor at ATF headquarters who served as a “crucial link” between ATF headquarters and the Phoenix Field Division.

“He received a wealth of information about Fast and Furious” — including the fact that straw purchasers had bought over 900 firearms, many of which ended up in Mexico — “but did not view it as his role as supervisor to ask questions about events in the field. He has publicly admitted to having failed in his duty to read information presented to him about the case.”

The report says McMahon rubber stamped critical documents that came across his desk without reading them.

McMahon also “gave false testimony to Congress about signing applications for wiretap intercepts in Fast and Furious,” the report says.

Operation Fast and Furious began in the fall of 2009 as part of a plan to track guns illegally purchased in the U.S. to Mexican drug cartels. The ATF lost track of most of the 2,000 weapons that were allowed to “walk” into Mexico, and two of the straw-purchased guns ended up at the scene of a U.S. border agent’s murder.

(Issa told Fox News that news of McMahon’s double-dipping will produce “more outrage for the family of fallen Border Patrol Agent Brian Terry.)

According to the final congressional report, “From the outset, the case was marred by missteps, poor judgments, and an inherently reckless strategy.”

Issa, who chairs the House Oversight and Government Reform Committee, has accused Attorney General Eric Holder and other Justice Department officials of undermining his investigation into Fast and Furious.


Read more…

Earth Watch Report – Friday August 24th, 2012


August 24, 2012 by desertrose


Mysterious Bubbles and  Sinkholes

Officials Find Another “Bubbles on the Bayou” Site in Louisiana Near Bayou Corne


The Assumption Parish Police Jury said it was discovered Monday between two previous sites in Grand Bayou.

A news release classified the bubbling as small and added it will be monitored daily.

A meeting is scheduled for Friday at St. Joseph the Worker Church Hall in Pierre Part at 6:30 p.m.

Tuesday is day four of drilling at the observation well near the giant South Louisiana sink hole in Assumption Parish. The company believed to be responsible for the sink hole, Texas Brine, brought members of the news media to examine what they hope will be a good piece of evidence as to what exactly happened at the sink hole 18 days ago.

The observation well is being used to show Louisiana DEQ officials exactly what happened to create the sink hole, or what they call a slurry.

Texas Brine is hooking its wagon to a 140-foot, 10-story drilling rig, and placed just 1,000 feet from the sink hole. The plan is for the well to drill to the salt dome believed to be responsible for the sink hole, and take observations of the dome. Those observations will be sent topside for analysis.

John Boudreaux is tired, he has worked 18 straight days at the staging area in Bayou Corne. Because the drilling will last at least another 40 days, he hopes things will be quiet.

“You have really two different events. You have the drilling, the observation event as they call it, but you have the sink hole and monitoring that and make sure that doesn’t expand or move any further,” said Boudreaux.

“We’ve got the casing, they are now drilling into the cap rock which covers the salt dome and I think once they get through that, things may move a little more rapidly,” said Sonny Cranch with Texas Brine.

Cap rock is being pulled out of the hold at 486 feet. It is pulverized by the drill bit before being sucked out of the ground. They are drilling 24 hours a day, seven days a week and Texas Brine is hoping they get some answers once the dome is pierced.

“All we want to know is what has happened,” said Cranch.

The drilling platform will be drilling for at least another 40 days. Texas Brine says 40 days is an optimistic goal.

Officials said the site of the slurry is still off limits and the cleanup remains halted.

The parish has requested Texas Brine provide a plan for continued cleanup.

*************************************************************************************************************

Biological Hazards / Wildlife / Hazmat

23.08.2012 Biological Hazard USA State of California, Burbank [700 block of Screenland Drive] Damage level Details

Biological Hazard in USA on Thursday, 23 August, 2012 at 06:35 (06:35 AM) UTC.

Description
Health officials have confirmed four people have contracted Murine typhus in Burbank. Two cases originated in the 700 block of Screenland Drive. Both of those men were treated at local hospitals and released. Murine typhus is also called endemic typhus and is transmitted by fleas. While rat fleas are the most common transmitters, cat fleas and mouse fleas can also transmit the Murine typhus virus.
Biohazard name: Murine typhus
Biohazard level: 2/4 Medium
Biohazard desc.: Bacteria and viruses that cause only mild disease to humans, or are difficult to contract via aerosol in a lab setting, such as hepatitis A, B, and C, influenza A, Lyme disease, salmonella, mumps, measles, scrapie, dengue fever, and HIV. “Routine diagnostic work with clinical specimens can be done safely at Biosafety Level 2, using Biosafety Level 2 practices and procedures. Research work (including co-cultivation, virus replication studies, or manipulations involving concentrated virus) can be done in a BSL-2 (P2) facility, using BSL-3 practices and procedures. Virus production activities, including virus concentrations, require a BSL-3 (P3) facility and use of BSL-3 practices and procedures”, see Recommended Biosafety Levels for Infectious Agents.
Symptoms:
Status: confirmed
24.08.2012 HAZMAT USA State of Washington, Richland [Hanford Nuclear Reservation] Damage level Details

HAZMAT in USA on Wednesday, 22 August, 2012 at 03:18 (03:18 AM) UTC.

Description
As part of the biggest, costliest environmental cleanup project in the nation’s history – disposing of 53 million gallons of radioactive waste at the Hanford Nuclear Reservation in Washington state – one thing was supposed to be sure: Waste stored in the sturdy, double-wall steel tanks that hold part of the toxic ooze wasn’t going anywhere. But that reassurance has been thrown into question with the discovery of a 3-foot-long piece of radioactive material between the inner and outer steel walls of one of the storage tanks, prompting new worries at the troubled cleanup site. “We’re taking it seriously, and we’re doing an investigation so we can better understand what it is,” Department of Energy spokeswoman Lori Gamache said. The discovery marks the first time material has been found outside the inner wall of one of the site’s 28 double-shell tanks, thought to be relatively secure interim storage for the radioactive material generated when Hanford was one of the nation’s major atomic production facilities. It opened in 1943 and began a gradual shutdown in 1964. Cleanup started in 1989. The $12.2-billion cleanup project eventually aims to turn most of the waste stored at Hanford into glass rods at a high-tech vitrification plant scheduled to be operational in 2019, assuming the formidable design and engineering hurdles can be overcome. In the meantime, plant engineers have been gathering waste stored in the facility’s 149 aging, leaky single-wall storage tanks and redepositing them in the double0-shell tanks for safekeeping. Over the years, more than 1 million gallons of waste has leaked out of 67 single-wall tanks into the surrounding soil.”There’s been this presumption that the double-shell tanks at least are sound and won’t fail, and they’ll be there for us,” said Tom Carpenter of the advocacy group Hanford Challenge. Several days ago the group obtained a memo from the cleanup site detailing discovery of the mysterious substance. “This changes everything. It is alarming that there is now solid evidence that Hanford double-shell has leaked,” Carpenter said in a separate statement on the discovery. The 42-year-old tank, known as AY-102, holds about 857,000 gallons of radioactive and other toxic chemical waste, much of it removed several years ago from a single-shell storage tank where it was considered unsafe. Workers who relocated the material fell ill simply from inhaling the fumes, Carpenter said. Department of Energy officials said none of the material has leaked outside the outer steel wall or the concrete casing that surrounds the structure, and there is no present hazard to workers or groundwater. They said they were trying to determine whether the material leaked from the inner tank or oozed from a nearby pit into the space between the two walls, known as the annulus. “There’s no evidence of it leaking the liquid from the inner shell right now,” Gamache said. The material – a mound 2 feet by 3 feet by 8 inches — is dry and doesn’t appear to be growing. It was discovered during a routine video inspection of the annulus conducted last month from a viewpoint not normally used. The possibility that it could have come as overflow from a nearby pit arises because a pipe runs into the annulus from the pit, Gamache said.But Carpenter, who has talked extensively with workers at Hanford and was briefed Tuesday by one of the Department of Energy’s senior officials at the tank farm, said he believed the evidence was strong that there was a leak. “I know Hanford would like it not to be so. But the people I’m talking to at the Hanford site say, no, it really does look like a leak,” he said. “From what I’m being told and looking at the pictures, it appears it’s coming from under the tank and going up. Which is a far cry from it coming from the pit.” Gamache said an initial sample of the material revealed that “the contamination levels were higher than expected” and it definitely contained radioactive waste. “There wasn’t enough material to fully characterize the material, so we’re preparing to pull another sample. That will probably happen around the mid-September time frame,” she said. Carpenter said that if the inner tank leaked, it would probably prompt the need to reevaluate expectations that the tanks could safely act as interim storage vessels for several decades.
Read more…

Solar Activity & Space

Earth Watch Report – Friday August 24th, 2012


Solar Activity

2MIN News August 23. 2012: Fukushima Fish. 5min Colorado Rain Record

Published on Aug 23, 2012 by Suspicious0bservers

TODAY’S LINKS
China Econ + Ours = More Easing: http://www.reuters.com/article/2012/08/23/us-china-economy-idUSBRE87M06620120823
Fukushima Fish: http://rt.com/news/fukushima-nuclear-radiation-fish-238/
California Wildfire: http://www.reuters.com/article/2012/08/23/us-usa-wildfires-west-idUSBRE87L0XU…
Vegas Flooding: http://www.weather.com/news/las-vegas-flooding-20120822
Colorado Rain Record: http://www.rssweather.com/wx/us/co/new%20liberty/wx.php
Weather Records: http://www.cocorahs.org/ViewData/ListIntensePrecipReports.aspx

REPEAT LINKS
Spaceweather: http://spaceweather.com/[Look on the left at the X-ray Flux and Solar Wind Speed/Density]

HAARP: http://www.haarp.alaska.edu/haarp/data.html[Click online data, and have a little fun]

SDO: http://sdo.gsfc.nasa.gov/data/[Place to find Solar Images and Videos - as seen from earth]

SOHO: http://sohodata.nascom.nasa.gov/cgi-bin/soho_movie_theater[SOHO; Lasco and EIT - as seen from earth]

Stereo: http://stereo.gsfc.nasa.gov/cgi-bin/images[Stereo; Cor, EUVI, HI - as seen from the side]

SunAEON:http://www.sunaeon.com/#/solarsystem/[Just click it... trust me]

SOLARIMG: http://solarimg.org/artis/[All purpose data viewing site]

iSWA: http://iswa.gsfc.nasa.gov/iswa/iSWA.html[Free Application; for advanced sun watchers]

NASA ENLIL SPIRAL: http://iswa.gsfc.nasa.gov:8080/IswaSystemWebApp/iSWACygnetStreamer?timestamp=…
NOAA ENLIL SPIRAL: http://www.swpc.noaa.gov/wsa-enlil/

NOAA Bouys: http://www.ndbc.noaa.gov/

RSOE: http://hisz.rsoe.hu/alertmap/index2.php[That cool alert map I use]

JAPAN Radiation Map: http://jciv.iidj.net/map/

LISS: http://earthquake.usgs.gov/monitoring/operations/heliplots_gsn.php

Gamma Ray Bursts: http://grb.sonoma.edu/[Really? You can't figure out what this one is for?]

BARTOL Cosmic Rays: http://neutronm.bartol.udel.edu//spaceweather/welcome.html[Top left box, look for BIG blue circles]

TORCON: http://www.weather.com/news/tornado-torcon-index[Tornado Forecast for the day]

GOES Weather: http://rsd.gsfc.nasa.gov/goes/[Clouds over America]

EL DORADO WORLD WEATHER MAP: http://www.eldoradocountyweather.com/satellite/ssec/world/world-composite-ir-…

PRESSURE MAP: http://www.woweather.com/cgi-bin/expertcharts?LANG=us&MENU=0000000000&…

HURRICANE TRACKER: http://www.weather.com/weather/hurricanecentral/tracker

INTELLICAST: http://www.intellicast.com/[Weather site used by many youtubers]

NASA News: http://science.nasa.gov/science-news/science-at-nasa/

*********************************************************************************************************************************

Space

Earth approaching objects (objects that are known in the next 30 days)

Object Name Apporach Date Left AU Distance LD Distance Estimated Diameter* Relative Velocity
(2012 BB14) 24th August 2012 0 day(s) 0.1234 48.0 27 m – 60 m 2.58 km/s 9288 km/h
(2012 FM52) 25th August 2012 1 day(s) 0.0599 23.3 510 m – 1.1 km 17.17 km/s 61812 km/h
66146 (1998 TU3) 25th August 2012 1 day(s) 0.1265 49.2 3.0 km – 6.8 km 16.03 km/s 57708 km/h
(2009 AV) 26th August 2012 2 day(s) 0.1615 62.8 670 m – 1.5 km 22.51 km/s 81036 km/h
331769 (2003 BQ35) 28th August 2012 4 day(s) 0.1585 61.7 240 m – 530 m 4.64 km/s 16704 km/h
(2010 SC) 28th August 2012 4 day(s) 0.1679 65.3 16 m – 36 m 9.56 km/s 34416 km/h
4769 Castalia 28th August 2012 4 day(s) 0.1135 44.2 1.4 km 12.06 km/s 43416 km/h
(2012 LU7) 02nd September 2012 9 day(s) 0.1200 46.7 440 m – 990 m 8.16 km/s 29376 km/h
(2012 FS35) 02nd September 2012 9 day(s) 0.1545 60.1 2.3 m – 5.2 m 2.87 km/s 10332 km/h
(2012 HG31) 03rd September 2012 10 day(s) 0.0716 27.9 440 m – 990 m 10.33 km/s 37188 km/h
(2012 PX) 04th September 2012 11 day(s) 0.0452 17.6 61 m – 140 m 9.94 km/s 35784 km/h
(2012 EH5) 05th September 2012 12 day(s) 0.1613 62.8 38 m – 84 m 9.75 km/s 35100 km/h
(2011 EO11) 05th September 2012 12 day(s) 0.1034 40.2 9.0 m – 20 m 8.81 km/s 31716 km/h
(2007 PS25) 06th September 2012 13 day(s) 0.0497 19.3 23 m – 52 m 8.50 km/s 30600 km/h
329520 (2002 SV) 08th September 2012 15 day(s) 0.1076 41.9 300 m – 670 m 9.17 km/s 33012 km/h
(2011 ES4) 10th September 2012 17 day(s) 0.1792 69.8 20 m – 44 m 12.96 km/s 46656 km/h
(2008 CO) 11th September 2012 18 day(s) 0.1847 71.9 74 m – 160 m 4.10 km/s 14760 km/h
(2007 PB8) 14th September 2012 21 day(s) 0.1682 65.5 150 m – 340 m 14.51 km/s 52236 km/h
226514 (2003 UX34) 14th September 2012 21 day(s) 0.1882 73.2 260 m – 590 m 25.74 km/s 92664 km/h
(1998 QC1) 14th September 2012 21 day(s) 0.1642 63.9 310 m – 700 m 17.11 km/s 61596 km/h
(2002 EM6) 15th September 2012 22 day(s) 0.1833 71.3 270 m – 590 m 18.56 km/s 66816 km/h
(2002 RP137) 16th September 2012 23 day(s) 0.1624 63.2 67 m – 150 m 7.31 km/s 26316 km/h
(2009 RX4) 16th September 2012 23 day(s) 0.1701 66.2 15 m – 35 m 8.35 km/s 30060 km/h
(2005 UC) 17th September 2012 24 day(s) 0.1992 77.5 280 m – 640 m 7.55 km/s 27180 km/h
(2012 FC71) 18th September 2012 25 day(s) 0.1074 41.8 24 m – 53 m 3.51 km/s 12636 km/h
(1998 FF14) 19th September 2012 26 day(s) 0.0928 36.1 210 m – 480 m 21.40 km/s 77040 km/h
331990 (2005 FD) 19th September 2012 26 day(s) 0.1914 74.5 320 m – 710 m 15.92 km/s 57312 km/h
1 AU = ~150 million kilometers,1 LD = Lunar Distance = ~384,000 kilometers Source: NASA-NEO

*********************************************************************************************************************************

Read more…

Radiation & Epidemic Hazards / Diseases

Radiation

Fukushima fish carrying 258 times the ‘safe’ level of radiation

An official from Thailand's Food and Drug Administration takes a sample from a shipment of frozen fish imported from Japan to test for possible radiation contamination at Ladkrabang customs in Bangkok (Reuters/Sukree Sukplang)

An official from Thailand’s Food and Drug Administration takes a sample from a shipment of frozen fish imported from Japan to test for possible radiation contamination at Ladkrabang customs in Bangkok (Reuters/Sukree Sukplang)

A pair of fish captured near Japan’s crippled Fukushima nuclear plant have shown to be carrying record levels of radiation. The pair of greenlings are contaminated with 258 times the level government deems safe for consumption.

­The fish, which were captured just 12 miles from the nuclear plant, registered 25,800 becquerels of caesium per kilo, according to Tokyo Electric Power Company (TEPCO).

TEPCO says the high levels may be due to the fish feeding in radioactive hotspots. The company plans on capturing and testing more of the fish, as well as their feed, and the seabed soil to determine the exact cause of the high radiation.

The findings were surprising for officials, who had previously seen much lower levels of radiation in contaminated fish.

Fishermen been allowed to cast their reels in the nearby waters on an experimental basis since June – but only in areas more than 31 miles from the plant.

Previously, the highest recorded radiation seen in the captured wildlife was 18,700 becquerels per kilo in cherry salmons, according to the Japanese Fisheries Agency.

The radiation was caused by a meltdown of three reactors at the Fukushima power plant after it was damaged by an earthquake and tsunami in March 2011.

The disaster was so intense that contaminated fish were caught all the way across the Pacific Ocean, on the California coast.

But it’s not only aquatic life that is suffering from side effects of the leaked radiation.

According to researchers, the radiation has caused mutations in some butterflies, giving them dented eyes, malformed legs and antennae, and stunted wings.

The results show the butterflies were deteriorating both physically and genetically.

But the harmful risks don’t stop with butterflies. The radioactivity which seeped into the region’s air and water has left humans facing potentially life threatening health issues.

Over a third of Fukushima children are at risk of developing cancer, according to the Sixth Report of Fukushima Prefecture Health Management Survey.

­The report shows that nearly 36 per cent of children in the Fukushima Prefecture have abnormal thyroid growths which pose a risk of becoming cancerous.

The World Health Organization warns that young people are particularly prone to radiation poisoning in the thyroid gland. Infants are most at risk because their cells divide at a higher rate.

************************************************************************************************************

Epidemic Hazards / Diseases

Bahamas reports 5 new cases amid bacteria outbreak

NASSAU, Bahamas: The health minister of the Bahamas says he has ordered an investigation into a bacteria outbreak at a local hospital following the death of two babies and amid reports of new cases.

Perry Gomez says four adults and one child in the general intensive care unit of Princess Margaret Hospital in Nassau are carrying the bacteria.

About a month ago, the acinetobacter bamannii outbreak sickened eight babies in the neonatal intensive care unit, killing two.

Gomez announced in Parliament Thursday that the ministry will hire a physician to investigate the outbreak.

The hospital reported a similar outbreak in August 1996 that killed three infants and infected five others.

The bacteria enter the body through open wounds, breathing tubes and catheters and are highly resistant to antibiotics.


Written by UN News Service Wednesday, 22 August 2012 15:39

altThe United Nations health agency today reported that the cholera outbreak in Sierra Leone was escalating and stressed the need to rapidly scale up the response to the spread of the of the frequently fatal water and food-borne disease.

In a press briefing in Geneva, Glenn Thomas, a spokesperson for the World Health Organization (WHO), confirmed the spread of cholera to an additional two districts of the West African country, noting that since the beginning of 2012, there had been 11,189 reported cases and 203 deaths due to the outbreak.

Mr. Thomas told reporters that the WHO was supporting the Government of Sierra Leone in the areas of epidemiology and social mobilization and had sent three cholera experts form its regional office to respond to the deteriorating crisis, UN News Service reports.

Cholera is an acute intestinal infection caused by eating food or drinking water contaminated with the bacterium known as vibrio cholerae. The disease has a short incubation period and produces a toxin that causes continuous watery diarrhoea, a condition that can quickly lead to severe dehydration and death if treatment is not administered promptly. Vomiting also occurs in most patients.

In his briefing, Mr. Thomas also provided an update on the outbreak of Ebola virus in the Democratic Republic of the Congo (DRC), where a total of 15 cases of viral contamination, including nine deaths, have been reported.

He said that the WHO was supporting the DRC Ministry of Health in conducting a series of epidemiological investigations as well as surveillance, public information and social mobilization initiatives.

Ebola is transmitted by direct contact with the blood, secretions, other bodily fluids or organs of infected persons or animals such as chimpanzees, gorillas, monkeys and antelopes, and it has an incubation period of two to 21 days.

Sufferers can experience fever, intense weakness, muscle pain, headaches and a sore throat, as well as vomiting, diarrhoea, rashes and impaired kidney and liver function. In the most severe cases, the virus leads to both external and internal bleeding. The most recent outbreak happened last month in Uganda with a total of 20 cases, including 14 deaths, reported across the western part of the country.

In its briefing, the WHO added that it did not recommend that any travel or trade restrictions be applied to the DRC because of the outbreak.

West Nile Is Spreading Farther and Faster This Season, CDC Says

PHOTO: Mosquitos are sorted at the Dallas County mosquito lab in Dallas, in this Aug. 16, 2012 file photo.
West Nile Virus: 47 States Exposed

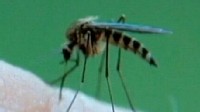
Aerial mosquito spraying is underway in Dallas County and Houston to prevent the spread of West Nile virus while the disease spreads farther, faster and earlier in the season than ever before, according to the U.S. Centers for Disease Control and Prevention.

Only 29 cases were reported a month ago. Now, the CDC is reporting 1,118 cases spread across 47 states, with 41 deaths.

Seventy-five percent of the cases have been reported from five states: Texas, Mississippi, Louisiana, Oklahoma and Illinois. Texas appears to be the hardest hit, with 586 reported cases in total. The death toll in Texas was 21 as of Wednesday, with Dallas County hit hardest, for a total of 270 cases and 11 deaths.

No place is striking back harder against the West Nile virus than Texas, which has launched an aerial assault against mosquitoes despite objections from environmental groups. Overnight, planes carrying pesticides took to the skies dousing more than 63,000 acres of land in Dallas and Houston to battle the disease.

“These kinds of chemicals are most toxic to young children, infants and babies,” said Jennifer Sass, senior scientist at the Natural Resources Defense Council.

Watch videos here

PHOTO: Mosquitos are sorted at the Dallas County mosquito lab in Dallas, in this Aug. 16, 2012 file photo.
LM Otero/AP Photo
Mosquitos are sorted at the Dallas County… View Full Size
West Nile Virus ‘Exploding’ in U.S. Watch Video
West Nile Virus Danger Watch Video
Dallas Fights West Nile Virus With Aerial Spray Watch Video

The CDC and health officials in Texas insist the worries about the spray are overblown and pale in comparison to the devastating effects of the disease. Harris County Mosquito Control Director Dr. Rudy Bueno told ABC News that the spray is “very safe and effective.”

“We normally kill 90, 95 percent of the mosquitoes that are out flying the night we put this out,” pilot Malcolm Williams said.

The CDC says this outbreak is on track to be the worst in the country’s history. The worst year on record is 2003, in which the country saw 9,862 cases of West Nile virus infection and 264 deaths.

Many experts point to last year’s mild winter for the drastic outbreak and the scorching temperatures this summer, helping the mosquitoes thrive.

Eighty percent of the people who contract the West Nile virus have no symptoms and their body eventually gets rid of it, according to the CDC. The remaining 20 percent experience flu-like symptoms.

One in 150 people will develop more severe forms of the disease and experience neurological symptoms and brain swelling, according to ABC News’ Dr. Richard Besser.

Patient Garrick Larson told ABC News affiliate WDAY in Minnesota, “I woke up with a headache like I have never come close to feeling before. The pain was immense. I knew I was in trouble.”

Larson, a cross country coach in Moorhead, Minn., was hospitalized for a week with a high fever and meningitis.

Deputy White House Press Secretary Josh Earnest briefed reporters aboard Air Force One as President Obama traveled from Las Vegas to New York Wednesday.

“The president’s been briefed on the increase in the number of West Nile virus cases,” he said. “[The] White House staff are at regular contact with the experts at the CDC, and the president will continue to receive updates as necessary.”

Researchers identify rare adult immune disease in Asia

By Saundra Young, CNN
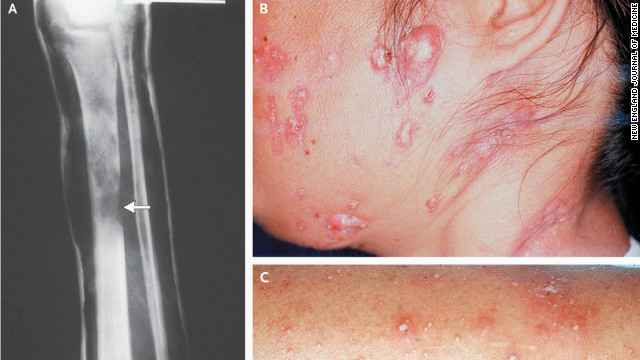
These are common disease manifestations in patients with anti-interferon-γ autoantibodies, according to researchers.

STORY HIGHLIGHTS
  • Patients with disease are making antibodies that attack their immune system
  • Cases date back to 2004, with most of them occurring in Thailand and Taiwan
  • Scientists do not believe the disease is contagious
  • The NIH has seen about 12 cases, all in people of Asian descent

(CNN) — Researchers at the National Institutes of Health (NIH) have identified a new disease among people in Asia that causes AIDS-like symptoms but is not associated with HIV.

The study, released in the New England Journal of Medicine Thursday, found patients with the disease were making antibodies that attacked their immune systems.

“We all make molecules and proteins in the body that tell our immune system how to function properly,” said Dr. Sarah Browne, a clinical investigator at the National Institute of Allergy and Infectious Diseases at NIH and the lead author on the study.

“They tell different immune cells when to turn on and when to start fighting infection,” she said. “We found a large number of the patients that we studied with serious opportunistic infections make an antibody that blocks the function of one of these molecules, which is interferon-gamma.”

Without functioning interferon-gamma, people become more susceptible to certain types of infections — infections people with working immune systems normally don’t get, she said.

The disease is being called an adult-onset immunodeficiency syndrome because it strikes adults. Cases date back to 2004, with most of them occurring in Thailand and Taiwan. The NIH has been studying the disease since 2005.

“It’s rare — more prevalent over in Southeast Asia,” Browne told CNN. “But we have been diagnosing it here in the U.S. in individuals of Asian descent.”

So far NIH has seen about 12 cases, all of them in people of Asian descent. According to Browne, most patients survive. There have been deaths in other countries, she said, but did not know how many. No one has died in the United States.

Dr. Anthony Fauci, director of NIAID, says it’s important to note the disease is not contagious.

“It is not a virus, that’s the first thing. It’s not a new AIDS-like virus,” Fauci said. “It’s a syndrome that was noticed and discovered in Asia where people get opportunistic infections similar to HIV/AIDS, but the cause of the syndrome is not an infection like HIV.”

Fauci said researchers “found the people have an autoimmunity, where their bodies are making antibodies against a protein that’s important in fighting infection.

“The reason the body is making that antibody is unclear but it isn’t a virus like HIV that’s causing it,” he said. ” It’s autoimmune disease, and people get secondary infections similar to AIDS.”

The study was already in the early stages in 2009, when Kim Nguyen, a 62-year-old Vietnamese woman from Tennessee, came to NIH suffering from symptoms that would be linked to the mystery disease.

A little more than 200 people — almost exclusively from Thailand and Taiwan between the ages of 18 and 78 — were studied. All were HIV-negative.

“We want to understand what triggers people to make these antibodies in the first place,” Browne said. “And we want to use that information to guide treatment — because really, when you treat the infection you’re treating the symptom. You’re not treating the underlying cause.”

Right now, doctors are simply treating the infections. For many of the patients, that’s sufficient, Browne said, but for those cases where it’s not, they are trying to find ways to target the antibodies themselves by lowering the antibody levels and trying to reverse the immunodeficiency.

Both Fauci and Browne believe a combination of both genetic and environmental factors are most likely at play, but don’t yet know what those factors are.

“Overall it appears to be a chronic disease, but we have not yet studied it for a long enough period of time to know the long-term prognosis,” Browne said. “We don’t yet know what factors may distinguish those with mild versus those with severe disease.”

19.08.2012 Epidemic Hazard Democratic Republic of the Congo Province of Orientale, [Haut Uele District] Damage level Details

Epidemic Hazard in Democratic Republic of the Congo on Friday, 17 August, 2012 at 03:03 (03:03 AM) UTC.

Back

Updated: Wednesday, 22 August, 2012 at 03:06 UTC
Description
The Ebola virus has killed 10 people in the Democratic Republic of Congo, the World Health Organization said Tuesday. As of Monday, WHO said, the deaths are among 13 probable and two confirmed Ebola cases reported in Orientale province in eastern Congo. The Congolese Ministry of Health has set up a task force to deal with the outbreak and is working with WHO, UNICEF, Doctors Without Borders and the Centers for Disease Control and Prevention. Twelve cases and eight deaths occurred in the area of Isiro, a town in Congo’s north, WHO said. The fatalities included three health care workers. One death each occurred in Congo’s Pawa and Dungu regions. Congo’s Orientale province borders western Uganda, where 24 probable and confirmed cases, including 16 deaths, have been reported since the beginning of July.But WHO spokesman Gregory Hartl told CNN that there’s no connection between the outbreaks in Uganda and Congo. The viruses, he said, are two different Ebola strains. There are five strains of the virus, a highly infectious and often fatal agent spread through direct contact with bodily fluids And, Hartl said, it is extremely difficult to travel between Isiro, for example, and Kiballe, the western Ugandan district where an outbreak emerged last month. That’s because it is heavily forested with impassable roads, and the only viable way to travel is going 10 to 15 kilometers per hour via motorbike. So it is unlikely there would be contact between Ugandans and Congolese that would lead to infection. The natural habitat of the Ebola virus is in the central African forest belt region, Hartl said. It’s “either by chance” or from “more surveying” for the disease, he said, that “we see these two outbreaks concurrently.” Health agencies have embarked on an aggressive approach in Uganda to deal with the cases. WHO has asked countries bordering Uganda to “enhance surveillance” for the virus. The last confirmed case in Uganda was admitted to an isolation facility on August 4, WHO said.
Read more…

Storms / Flooding

Storms / Flooding

  Active tropical storm system(s)
Name of storm system Location Formed Last update Last category Course Wind Speed Gust Wave Source Details
Tembin (15W) Pacific Ocean 19.08.2012 24.08.2012 Typhoon IV 245 ° 185 km/h 232 km/h 5.79 m JTWC Details

 Tropical Storm data

Share:
Storm name: Tembin (15W)
Area: Pacific Ocean
Start up location: N 17° 42.000, E 124° 36.000
Start up: 19th August 2012
Status: Active
Track long: 403.97 km
Top category.:
Report by: JTWC
Useful links:
Past track
Date Time Position Speed
km/h
Wind
km/h
Gust
km/h
Category Course Wave Pressure Source
19th Aug 2012 05:28:29 N 17° 42.000, E 124° 36.000 9 56 74 Tropical Depression 190 11 JTWC
20th Aug 2012 05:16:05 N 18° 0.000, E 124° 48.000 6 139 167 Typhoon I. 360 9 JTWC
21st Aug 2012 04:48:23 N 20° 12.000, E 125° 18.000 13 213 259 Typhoon IV. 360 15 JTWC
23rd Aug 2012 04:49:56 N 22° 30.000, E 123° 36.000 4 204 232 Typhoon III. 270 9 JTWC
Current position
Date Time Position Speed
km/h
Wind
km/h
Gust
km/h
Category Course Wave
feet
Pressure Source
24th Aug 2012 05:23:44 N 22° 6.000, E 120° 30.000 19 185 232 Typhoon IV 245 ° 19 JTWC
Forecast track
Date Time Position Category Wind
km/h
Gust
km/h
Source
25th Aug 2012 06:00:00 N 22° 30.000, E 118° 36.000 Typhoon III 167 204 JTWC
26th Aug 2012 06:00:00 N 21° 48.000, E 118° 18.000 Typhoon III 148 185 JTWC
27th Aug 2012 06:00:00 N 21° 30.000, E 118° 48.000 Typhoon II 130 157 JTWC
28th Aug 2012 06:00:00 N 22° 0.000, E 119° 42.000 Typhoon I 102 130 JTWC
Bolaven (16W) Pacific Ocean 20.08.2012 24.08.2012 Typhoon IV 325 ° 194 km/h 241 km/h 4.88 m JTWC Details

Tropical Storm data

Share:
Storm name: Bolaven (16W)
Area: Pacific Ocean
Start up location: N 17° 18.000, E 141° 30.000
Start up: 20th August 2012
Status: Active
Track long: 575.15 km
Top category.:
Report by: JTWC
Useful links:
Past track
Date Time Position Speed
km/h
Wind
km/h
Gust
km/h
Category Course Wave Pressure Source
20th Aug 2012 05:13:46 N 17° 18.000, E 141° 30.000 13 56 74 Tropical Depression 330 12 JTWC
21st Aug 2012 04:47:46 N 18° 12.000, E 140° 30.000 9 93 120 Tropical Storm 295 10 JTWC
23rd Aug 2012 04:49:02 N 19° 42.000, E 135° 36.000 9 167 204 Typhoon II. 280 10 JTWC
Current position
Date Time Position Speed
km/h
Wind
km/h
Gust
km/h
Category Course Wave
feet
Pressure Source
24th Aug 2012 05:22:54 N 21° 0.000, E 133° 36.000 11 194 241 Typhoon IV 325 ° 16 JTWC
Forecast track
Date Time Position Category Wind
km/h
Gust
km/h
Source
25th Aug 2012 06:00:00 N 24° 0.000, E 130° 12.000 SuperTyphoon 222 269 JTWC
26th Aug 2012 06:00:00 N 26° 36.000, E 127° 48.000 SuperTyphoon 213 259 JTWC
27th Aug 2012 06:00:00 N 31° 18.000, E 125° 30.000 Typhoon IV 194 241 JTWC
28th Aug 2012 06:00:00 N 37° 12.000, E 123° 36.000 Typhoon II 139 167 JTWC
Isaac (AL09) Atlantic Ocean 21.08.2012 24.08.2012 Tropical Depression 290 ° 74 km/h 93 km/h 5.79 m NOAA NHC Details

Tropical Storm data

Share:
Storm name: Isaac (AL09)
Area: Atlantic Ocean
Start up location: N 15° 12.000, W 51° 12.000
Start up: 21st August 2012
Status: Active
Track long: 1,166.86 km
Top category.:
Report by: NOAA NHC
Useful links:
Past track
Date Time Position Speed
km/h
Wind
km/h
Gust
km/h
Category Course Wave Pressure Source
22nd Aug 2012 04:54:04 N 15° 36.000, W 55° 36.000 30 65 83 Tropical Storm 275 16 1006 MB NOAA NHC
23rd Aug 2012 05:06:43 N 15° 48.000, W 63° 0.000 31 74 93 Tropical Storm 270 22 1003 MB NOAA NHC
Current position
Date Time Position Speed
km/h
Wind
km/h
Gust
km/h
Category Course Wave
feet
Pressure Source
24th Aug 2012 05:17:31 N 16° 42.000, W 68° 42.000 28 74 93 Tropical Depression 290 ° 19 1001 MB NOAA NHC
Forecast track
Date Time Position Category Wind
km/h
Gust
km/h
Source
25th Aug 2012 12:00:00 N 20° 12.000, W 75° 24.000 Tropical Depression 83 102 NOAA NHC
25th Aug 2012 00:00:00 N 18° 48.000, W 73° 6.000 Tropical Depression 83 102 NOAA NHC
26th Aug 2012 00:00:00 N 21° 48.000, W 77° 42.000 Tropical Depression 83 102 NOAA NHC
27th Aug 2012 00:00:00 N 24° 48.000, W 82° 0.000 Hurricane I 102 120 NOAA NHC
28th Aug 2012 00:00:00 N 27° 30.000, W 85° 30.000 Hurricane II 130 157 NOAA NHC
29th Aug 2012 00:00:00 N 30° 0.000, W 88° 0.000 Hurricane III 148 185 NOAA NHC
Joyce (AL10) Atlantic Ocean 22.08.2012 24.08.2012 Tropical Depression 300 ° 56 km/h 74 km/h 5.18 m NOAA NHC Details

Tropical Storm data

Share:
Storm name: Joyce (AL10)
Area: Atlantic Ocean
Start up location: N 12° 24.000, W 36° 18.000
Start up: 22nd August 2012
Status: Active
Track long: 563.51 km
Top category.:
Report by: NOAA NHC
Useful links:
Past track
Date Time Position Speed
km/h
Wind
km/h
Gust
km/h
Category Course Wave Pressure Source
23rd Aug 2012 05:05:37 N 13° 48.000, W 39° 30.000 28 56 74 Tropical Depression 295 15 1007 MB NOAA NHC
Current position
Date Time Position Speed
km/h
Wind
km/h
Gust
km/h
Category Course Wave
feet
Pressure Source
24th Aug 2012 05:18:15 N 16° 18.000, W 43° 42.000 22 56 74 Tropical Depression 300 ° 17 1008 MB NOAA NHC
Forecast track
Date Time Position Category Wind
km/h
Gust
km/h
Source
25th Aug 2012 12:00:00 N 20° 42.000, W 52° 12.000 Tropical Depression 56 74 NOAA NHC
25th Aug 2012 00:00:00 N 18° 54.000, W 48° 54.000 Tropical Depression 56 74 NOAA NHC
26th Aug 2012 00:00:00 N 22° 48.000, W 55° 30.000 Tropical Depression 56 74 NOAA NHC
27th Aug 2012 00:00:00 N 27° 0.000, W 62° 0.000 Tropical Depression 65 83 NOAA NHC
28th Aug 2012 00:00:00 N 31° 30.000, W 64° 30.000 Tropical Depression 83 102 NOAA NHC
29th Aug 2012 00:00:00 N 36° 0.000, W 58° 0.000 Tropical Depression 93 111 NOAA NHC

………………………..

Tropical Storm Isaac takes aim at Puerto Rico, threatens Haiti

TODAY’s Al Roker tracks Tropical Storms Isaac’s current path as it takes aim at Puerto Rico and the eastern Caribbean.

By Weather.com and wire reports

Updated at 11:12 a.m. ET: Tropical Storm Isaac brought rain and gusty winds to Puerto Rico and the eastern Caribbean Islands and was expected to gradually strengthen as it moved west through the northeastern Caribbean on Thursday.

Forecasters said it was too soon to gauge Isaac’s potential impact on Tampa on Florida’s Gulf Coast, where the Republican National Convention is to run from Monday through Thursday.

Related: Track Tropical Storm Isaac

Some computer models showed Isaac shifting slightly to the west and eventually moving parallel to Florida’s western coastline. Others forecast the storm to make landfall in South Florida and then move inland.

Forecasters predict Isaac will become a hurricane by Friday morning, but perhaps the more ominous threat in the short term is the potential for extremely heavy rainfall over the islands near Isaac’s path, weather.com reported.

More than a foot of rainfall, and potentially as much as 20 inches in some places, was possible on the island of Hispaniola, home to Haiti and the Dominican Republic. Life-threatening flash floods and mudslides could result from that amount of rain.

Residents and visitors of the northern Caribbean, Yucatan Peninsula, southeastern United States and the central/eastern Gulf Coast should watch the progress of Isaac closely over the next week or more, weather.com reported.

Numerous watches and warnings have been issued, including a hurricane warning for Haiti and the south coast of the Dominican Republic. Puerto Rico was under a tropical storm warning, and it was expected to see its greatest impacts from Isaac on Thursday.

Get the latest on this story from weather.com

On Thursday, Isaac was passing just south of Puerto Rico. As the storm approached, Puerto Rico Governor Luis Fortuno declared a state of emergency, canceled classes, closed government agencies and activated the National Guard.

The government also froze prices on basic necessities such as food, batteries and other supplies and prepared emergency shelters at schools and other facilities.

Despite Tropical Storm Isaac’s threatening winds and rains ahead of the GOP convention in Florida, Mitt Romney and running mate Paul Ryan are taking aim at President Obama and his handling of the economy. NBC’s Peter Alexander reports.

Isaac was projected to weaken to a tropical storm over Haiti and then pass over Cuba before strengthening into a hurricane in the Florida Straits between Cuba and Florida. Its exact path after that remained uncertain.

Heavy rainfall, flooding and mudslides will be threats in all of the northern Caribbean islands regardless of how strong the system becomes, weather.com reported.

Isaac may also threaten U.S. energy interests in the Gulf of Mexico, weather experts said. It was centered about 265 miles southeast of San Juan, Puerto Rico, early on Thursday, the U.S. National Hurricane Center said. Isaac had top sustained winds of 45 miles per hour.

From weather.com: Isaac’s looming US threat

At the Guantanamo Bay U.S. Naval Base in southeast Cuba on Wednesday, authorities said Isaac forced the postponement of pretrial hearings that were to begin on Thursday for five prisoners accused of plotting the September 11 attacks.

The U.S. military was preparing flights to evacuate the base of lawyers, paralegals, interpreters, journalists, rights monitors and family members of 9/11 victims who had traveled there for the hearings.

From weather.com: Track Isaac’s path

Lixion Avila, a senior hurricane specialist at the hurricane center, suggested it would be foolish for anyone to think Tampa — where Republicans will nominate Mitt Romney as their presidential candidate — was out of harm’s way.

Hurricane expert Jeff Masters of private forecaster Weather Underground said Tampa had a 9 percent chance of getting hit with tropical storm-force winds for a 24-hour period ending on the morning the Republican convention kicks off. But that could make the storm a non-event in terms of the convention itself.

“I put the odds of an evacuation occurring during the convention in the current situation at 3 percent,” Masters said in his blog on the weatherunderground.com website.

Tropical Storm Isaac churns over Caribbean, could threaten GOP convention

Orange juice prices rise
Florida has not been hit by a major hurricane since 2005 and forecasts showed Isaac was not expected to strengthen beyond a weak Category 1, with top sustained wind speeds of about 80 mph.

The threat to Florida triggered a nearly 6 percent jump in orange juice prices on Wednesday as they surged to a six-week high in trading in New York.

Florida produces more than 75 percent of the U.S. orange crop and accounts for about 40 percent of the world’s orange juice supply.

Lurking behind Isaac, the hurricane center said another tropical depression grew into Tropical Storm Joyce on Thursday.

Located about 1,045 miles west of the Cape Verde Islands, it was packing winds of 40 mph and was moving northwest at 17 mph.

Forecasts predicted it will eventually veer toward the open Atlantic and away from the Caribbean. No coastal watches or warnings were in effect for Joyce.

Reuters and weather.com contributed to this report.

2pm Update: Isaac not strengthening … yet

Isaac remains disorganized

Tropical Storm Isaac has strengthened slightly, data from the hurricane hunters show, but the storm remains disorganized and difficult to forecast. If you have to make decisions based upon what Isaac will do, I highly recommend that you wait until at least Friday morning to make a decision, if at all possible, as the forecasts then should be of significantly higher accuracy. Isaac continues to have a large area of light winds about 50 miles across near its center. This makes the storm subject to reformations of the center closer to areas of heavy thunderstorms that form, resulting in semi-random course changes. Until Isaac consolidates, the lack of a well-defined center will make forecasts of the storm’s behavior less accurate than usual. An Air Force Reserve hurricane hunter aircraft is in Isaac this afternoon, and has found that surface tropical storm-force winds on the east side of the storm, south of Puerto Rico, have undergone a modest expansion. These winds were mostly in the 40 mph range, with a few areas of 45 mph winds. The surface pressure remained fairly high, at 1004 mb. Infrared and visible satellite loops show that Isaac has fairly symmetric circular cloud pattern, with developing spiral bands that are contracting towards the center, which suggests intensification. However, the storm has a very clumpy appearance, and is a long way from being a hurricane. Given the storm’s continued reluctance to organize, Isaac is unlikely to reach hurricane strength before encountering Haiti and Cuba. An analysis of upper level winds from the University of Wisconsin CIMSS shows an upper-level outflow channel well-established to the north, and an intermittent outflow channel to the south. Radar imagery from Puerto Rico shows some weak low-level spiral bands that haven’t changed much in intensity or organization this afternoon. NOAA buoy 42060 reported 1-minute mean winds of 35 mph and a wind gust of 40 early this afternoon. At St. Thomas in the Virgin Islands, wind gusts up to 45 mph were observed early this afternoon. Isaac’s rains caused major flooding last night in Trinidad and Tobago, the southernmost islands of the Lesser Antilles chain, according to the Trinidad Express. Isaac’s rains have not been heavy enough today to cause flooding problems on other islands.


Figure 1. True-color MODIS image of Isaac taken at 1:40 pm EDT August 23, 2012. Image credit: NASA.

Latest model runs for Isaac
The latest set of 12Z (8 am EDT) model runs have shifted to the west compared to the previous set of runs. The models continue to show a west-northwestward track to a point on the south coast of Hispaniola, then across eastern Cuba and into the Florida Straits between Florida and Cuba. A trough of low pressure is then expected to pull Isaac to the northwest and then north, towards the Florida Panhandle. The big news in this model cycle is that both of our top models–the GFS and ECMWF–predict that 5 – 6 days from now, the trough of low pressure pulling Isaac to the north may not be strong enough to finish the job. These models predict that the trough will lift out and a ridge of high pressure will build in, forcing Isaac more to the west. The GFS predicts this will occur after Isaac makes landfall in the Florida Panhandle, resulting in Isaac moving slowly to the west over land, from Georgia to Alabama. The ECMWF predicts the westward motion will happen while Isaac is in the northern Gulf of Mexico, resulting in an eventual landfall near the Louisiana/Texas border on Thursday. There are some huge issues to resolve to make an accurate long-range track forecast for Isaac. Where will its center consolidate? How will the interaction with the mountains of Hispaniola and Cuba will affect it? Where will Isaac pop off the coast of Cuba? Hopefully, the data being collected by the NOAA jet this afternoon will give us a more unified set of model forecasts early Friday morning. For now, pay attention to the cone of uncertainty. If you’re in the cone, you might get hit.

By Wang Qian  (China Daily)

A worker tapes the window of a convenience store in Hualien, Taiwan province, on Wednesday, in preparation for typhoon Tembin. (Photo/China Daily)

Two powerful typhoons are heading toward China, putting the weather-beaten nation on alert again after four storms have caused landfalls across the country since the start of August.

“Typhoons Tembin and Bolaven may have a combined impact on coastal areas in the coming 10 days,” Zhang Chang’an, chief forecaster at the China Meteorological Administration, said on Wednesday.

Both storms are strengthening, with Bolaven expected to be the strongest typhoon to hit China this year if it lands in the country, Zhang said, adding that the storm will bring maximum winds of 220 km/h.

The National Commission on Disaster Reduction issued a typhoon alert on Wednesday, warning authorities to make emergency plans.

Tembin was about 2,000 km from the coast of Zhejiang province on Wednesday, moving at a speed of 5 km/h.

The administration has asked authorities in potential affected areas to set up warning signs in high-risk areas such as construction sites and low-lying areas, and open emergency shelters including schools and stadiums for evacuation of affected people.

The Fujian Meteorological Bureau urged boats to take shelter in ports by Wednesday to avoid possible damage brought by Tembin.

Oregon Coast residents stash tsunami survival kits on high ground

By The Associated Press Published 

Oregon Coast residents stash tsunami survival kits on high ground


Cannon Beach City Councilor Sam Steidel displays the three containers residents can choose from to store their emergency supplies on Aug. 10, 2012 in Cannon Beach, Ore. By Oct. 18, when a statewide earthquake drill called the “Great Oregon Shakeout” is planned, city officials expect to complete the placement of at least one shipping container on Elk Creek Road, east of U.S. Highway 101. (AP Photo/The Daily Astorian, Nancy McCarthy)


CANNON BEACH, Ore. (AP) — What does one stash for a tsunami? Residents of Cannon Beach are thinking about that.

They’re planning to store drums full of survival gear far enough inland and high enough to be safe if the big one hits the Oregon coast and sends a tsunami wave ashore.

The Daily Astorian reports
the city is offering residents space in a shipping container and various sizes of drums, barrels and buckets that can be stored inside.

Cannon Beach held a workshop on how to pack for the days after the big one, the equivalent of last year’s Japanese earthquake that could send a deadly tsunami across West Coast beaches and flood coastal towns.

Essential items would include a shelter, such as a tent or tarp; sleeping bags or blankets; food with a long shelf life, such as ready-to-eat meals or canned goods, and a can opener; a basic first-aid kit, either pre-assembled or one containing personal medical items; a survival knife; axe or hatchet; garden trowel or folding shovel; flashlights with extra batteries; matches or lighter with a fire starter; water purification; and bottles or canteens for water storage.

“We’re encouraging people not to turn this into a big to-do,” said City Council member Sam Steidel. “Most things they will need they can find at rummage sales, or they could be surplus stuff they find around the house that they’re not using all the time.”

“I have packed my barrel with enough things for a two-person camp,” said Steidel, who participates in Civil War re-enactments. “The things are pretty much up-to-date items that are in the re-enactment trailer. A simple pot or Dutch oven is all you really need to cook with. Just about everyone has an old cast iron fry pan.”

Cannon Beach is a popular tourist destination on the north Oregon coast, at the other end of a highway from Portland. It’s also known for thinking hard and creatively about tsunamis — something critics say has been lacking along the West Coast.

A few years ago, Cannon Beach looked at the idea of rebuilding City Hall on stilts to provide refuge for people fleeing a tsunami. Computer modeling showed that the location wasn’t the best, and a study of alternative ideas continues.

Recently, state and federal officials said they plan to use Cannon Beach in a pilot study of how landscape and a town’s demographics affect how long it takes for people to flee a tsunami.

For the storage exercise, the city is preparing a 2,000-square-foot pad for at least one, and perhaps two shipping containers, each 20 feet long, 8 feet wide and 8 feet high. The pad is inland, east of the coastal highway, and planned for an elevation above the expected inundation level.

Each shipping container could hold at least 50 of the largest containers offered, those of 55-gallon capacity, Steidel said.

There also are 30-gallon plastic barrels and five-gallon buckets.

In October, the shipping container is to be opened for families to store their emergency stashes. Unless there’s a disaster, the container wouldn’t be reopened until spring, when the caches could be restocked.

Earlier this year, 53 people at a forum signed up for the small containers, and orders are being accepted for more. City officials said some families are buying more than one.

In addition to a purchase fee, the city is charging an annual maintenance fee based on capacity. A 55-gallon plastic barrel costs $57.90, and the annual fee is $55.

___

Information from: The Daily Astorian, http://www.dailyastorian.com

Photos »

Related Content

Fresh flood kills four in southern Russia

by Staff Writers
Moscow (AFP)

Russian authorities said Wednesday that a flash flood had killed four people in the southern Krasnodar region where 172 people drowned in rising waters last month, many trapped in their homes.

“Four people have died,” a spokeswoman for the regional emergency situations ministry told AFP.

“Three people are listed as missing,” the Krasnodar regional government said in a statement.

Heavy rain battered the coastal Tuapse area overnight causing many rivers to overflow and flood the houses and apartments of around 1,837 people, the regional authorities said.

In July, 172 people were found dead after severe flooding in the Krymsk area not far from Tuapse. Around 35,000 people lost some or all of their possessions.

The local authorities faced widespread censure for their failure to warn people in time of the need to evacuate. Three officials have been arrested and accused of negligence leading to the deaths.

On Wednesday the regional government stressed that this time the warning system had functioned “in time” so that the public was not caught unaware by the flooding.

“There will not be a second Krymsk,” the regional government promised, saying that residents had been warned this time with an onscreen message on local television and officials driving the streets with loudspeakers.

Related Links
Bringing Order To A World Of Disasters
When the Earth Quakes
A world of storm and tempest

23.08.2012 Flash Flood Pakistan MultiStates, [States of Punjab and North West Frontier ] Damage level Details

Flash Flood in Pakistan on Thursday, 23 August, 2012 at 04:53 (04:53 AM) UTC.

Description
Punjab and Khyber Pakhtunkhwa are facing the threat of floods because of heavy rains which various districts of the two provinces are likely to receive over the next two days. The late spell of monsoon has already claimed 11 lives in parts of Khyber Pakhtunkhwa and Bajaur Agency while eight people have died in Azad Kashmir. Officials said that torrential rains triggered flash floods in hill torrents in Nowshera, Mansehra and Bajaur Agency. The provincial disaster management authority said that floods had killed three people in Nowshera and six in Mansehra districts. A landslide blocked a portion of the main highway near Garhi Habibullah, Mansehra district. In Rawalpindi’s Kotli Sattiyan area, Ahmed Nawaz, a retired army man, lost three children-a son and two daughters- when a wall of their room collapsed after heavy rain. The three children were asleep when the wall collapsed on them, killing them on the spot. National Disaster Management Authority chairman Dr Zafar Iqbal Qadir told Dawn on Wednesday that catchment areas of Chenab and Ravi rivers’ distributaries were expected to receive heavy rains over the next two days. This may cause floods in Lahore, Faisalabad and Gujranwala divisions. He said the District Management Authority had been placed on alert.Areas around Jhelum river are also likely to receive rains which will raise the level of Mangla dam and will be of benefit to agriculture. He said the level at Mangla had risen by five feet over the past three days to reach 1,173 feet and was expected to go up by another 10-15 feet during the upcoming spell – sufficient for the irrigation requirements. He said there were fears of flash flood in urban areas of Khyber Pakhtunkhwa, particularly in Nowshera, Peshawar, Mardan, Swat and Buner. He said the PDMA was fully operational in the province and working round the clock to cope with any situation and minimise losses. In reply to a question, he said the threat of drought was not yet fully over, but it had substantially fallen. He said Makran, Kharan, Chaghai and Washuk areas in Balochistan were not receiving rains and might face drought if the dry weather persisted. “There is no possibility of massive flooding and the heavy downpour is likely to cause medium-level floods.” The country saw worst flooding of its history in 2010. It affected one-fifth of the population and rendered several hundred thousand people homeless right from Himalayas in the north to the deserts of Sindh in the south. The following year, comparatively low-intensity floods hit the country again, especially parts of lower Sindh. This year the monsoon spell in the middle of July and August was predicted to cause disaster with a forecast of 15 per cent more than the usual rains, but the situation suddenly changed and the threat of flood turned into one of drought. The situation has once again changed and now moderate floods are likely in at least two provinces.According to the Flood Forecasting Division (FFD), heavy rains triggered a low flood in the Ravi river at Shahdara on Wednesday. The Ravi, Jhelum and Chenab rivers were expected to attain medium to high flood by Friday. The three rivers swelled because of rains in their catchment areas during Eid holidays. The FFD centre in Lahore forecast fairly widespread thunderstorm/rain, with isolated heavy to very heavy falls (extremely heavy at one or two places) over Azad Kashmir, northern and north-eastern Punjab (mostly areas falling within Lahore, Gujranwala and Rawalpindi divisions) for Thursday. Azad Kashmir covers the upper and low catchments of the Jhelum river while northern and north-eastern Punjab constitutes the lower catchments of the Chenab and Ravi. The rain forecast means the water level will shoot up by Friday. Riaz Khan, the FFD chief, however said the situation was not alarming.

Rain in the Jhelum catchments would help fill Mangla Dam. The Chenab and Ravi were approaching flood level because of rain in their lower catchments in Pakistan while rain in their upper catchments in India was being stored in dams. “Hence there is no threat of devastating floods.” The FFD reported that a peak of 40,000 cusecs was passing the Ravi at Shahdara on Wednesday evening and the level was rising. The river was in low flood and was expected to attain medium flood level on Thursday. The FFD expected medium to high flood in Jhelum river at Mangla and in Chenab at Marala and Khanki on Thursday or Friday. Heavy rains flooded the Dek and Basantar nullahs in Sialkot region, submerging hundreds of acres of agricultural land. Traffic also remained suspended on Narowal-Pasrur road because of the flooding. The FFD expected more flooding of almost all nullahs in the region over 24 hours.

The Met office reported that Kakul had received 84mm of rain, Murree 77mm, Jhelum 76mm, Sialkot airport 74mm, Mandi Bahauddin 60mm, Mangla 39mm, Kotli 37mm, Sialkot Cantt 32mm, Cherat 29mm, Saidu Sharif 21mm, Islamabad 14mm, Rawlakot 12mm, Muzaffarabad 10mm, Gujranwala 8mm, and Balakot 4mm.

It also forecast scattered thunderstorm/rain with isolated heavy showers over Khyber Pakhtunkhwa as well as Sahiwal, Faisalabad and Sargodha divisions of Punjab for Thursday. Azad Kashmir Prime Minister Chaudhry Abdul Majeed on Wednesday appealed to the federal government to help his administration in rehabilitation of rain victims. A spell of relentless rain since Sunday has displaced thousands of people in the region, besides leaving eight dead. In Muzaffarabad, the capital, one person was killed and landslides threatened over 100 families living on the outskirts of the city. Within the city area, many areas were virtually buried under a huge rock that the gushing rainwater had brought with it. Four people were killed in Bagh district on Eid day and two children died in Mirpur on Wednesday in incidents of house collapse and drowning. Officials said almost all inter-city roads had been cleared for traffic.

Today Flash Flood USA State of Nevada, [Henderson and Las Vegas region] Damage level Details

Flash Flood in USA on Friday, 24 August, 2012 at 03:33 (03:33 AM) UTC.

Description
A teenager was missing Thursday after heavy rain in southern Nevada brought flash flooding to both Las Vegas and Henderson. The 17-year-old disappeared late Wednesday morning in Henderson. He was swept into flood waters in Pittman Wash. Firefighters say the teen was with friends who witnessed his disappearance. Bud Cranor, a spokesman for the city, said a search for him turned up nothing. “I noticed a man go right through, right in the middle of it,” Mike Harms said. “I got in the car and rode down. I saw him one more time, he was waving his arms and yelling for help, but it was hopeless because he was going so fast, he was gone.” While the water had receded in most areas, it left debris behind. The Desert Rose Golf Course in Las Vegas was covered with trash, including a shopping cart and bottles. For some daredevils, the flood was a chance to show off, authorities said. A Metro Las Vegas helicopter pilot, sent to check out a report of teens riding an air mattress down a flooded wash, saw them leave the water without injury
Read more…

Earthquakes & Volcanic Activity

Earthquakes

RSOE  EDIS

Date/Time (UTC) Magnitude Area Country State/Prov./Gov. Location Risk Source Details
24.08.2012 05:56:57 2.3 North America United States Alaska Petersville VulkĂĄn 0 VulkĂĄn 0 VulkĂĄn 0 USGS-RSOE Details
24.08.2012 05:50:58 2.4 North America United States Hawaii Fern Forest There are volcano(s) nearby the epicenter. VulkĂĄn 0 VulkĂĄn 0 USGS-RSOE Details
24.08.2012 05:55:45 2.6 Europe Greece Peloponnese Methoni VulkĂĄn 0 There are airport(s) nearby the epicenter. VulkĂĄn 0 EMSC Details
24.08.2012 05:56:05 4.1 Europe Greece Peloponnese Methoni VulkĂĄn 0 VulkĂĄn 0 VulkĂĄn 0 EMSC Details
24.08.2012 04:20:30 2.6 North America United States Alaska Anchor Point There are volcano(s) nearby the epicenter. VulkĂĄn 0 VulkĂĄn 0 USGS-RSOE Details
24.08.2012 04:50:20 2.3 Europe Czech Republic Horni Sucha VulkĂĄn 0 There are airport(s) nearby the epicenter. VulkĂĄn 0 EMSC Details
24.08.2012 03:05:36 2.5 North America United States California Mammoth Lakes There are volcano(s) nearby the epicenter. VulkĂĄn 0 VulkĂĄn 0 USGS-RSOE Details
24.08.2012 03:50:19 2.5 Europe Greece West Greece Kaminia VulkĂĄn 0 There are airport(s) nearby the epicenter. VulkĂĄn 0 EMSC Details
24.08.2012 02:20:24 2.3 North America United States California Redwood Valley There are volcano(s) nearby the epicenter. VulkĂĄn 0 VulkĂĄn 0 USGS-RSOE Details
24.08.2012 02:10:28 2.4 North America United States California Pearsonville There are volcano(s) nearby the epicenter. There are airport(s) nearby the epicenter. VulkĂĄn 0 USGS-RSOE Details
24.08.2012 01:10:27 2.0 North America United States Alaska Lake Minchumina VulkĂĄn 0 VulkĂĄn 0 VulkĂĄn 0 USGS-RSOE Details
24.08.2012 00:40:24 3.1 Europe Greece West Greece Andritsaina VulkĂĄn 0 There are airport(s) nearby the epicenter. VulkĂĄn 0 EMSC Details
24.08.2012 02:45:31 2.1 Asia Turkey Van Yuvacik There are volcano(s) nearby the epicenter. There are airport(s) nearby the epicenter. VulkĂĄn 0 EMSC Details
24.08.2012 02:45:53 2.1 Asia Turkey Van Yuvacik VulkĂĄn 0 There are airport(s) nearby the epicenter. VulkĂĄn 0 EMSC Details
24.08.2012 00:25:30 2.1 North America Canada British Columbia Princeton VulkĂĄn 0 There are airport(s) nearby the epicenter. VulkĂĄn 0 USGS-RSOE Details
24.08.2012 01:45:44 2.1 Europe Greece North Aegean Agios Dimitrios VulkĂĄn 0 There are airport(s) nearby the epicenter. VulkĂĄn 0 EMSC Details
24.08.2012 03:25:26 3.3 North America United States Alaska False Pass VulkĂĄn 0 VulkĂĄn 0 VulkĂĄn 0 USGS-RSOE Details
23.08.2012 22:40:22 2.1 Europe Italy Sicily Panarea There are volcano(s) nearby the epicenter. There are airport(s) nearby the epicenter. VulkĂĄn 0 EMSC Details
23.08.2012 23:40:26 2.2 Europe Czech Republic Albrechtice VulkĂĄn 0 There are airport(s) nearby the epicenter. VulkĂĄn 0 EMSC Details
23.08.2012 22:40:50 2.6 Europe Italy Veneto Galzignano VulkĂĄn 0 There are airport(s) nearby the epicenter. VulkĂĄn 0 EMSC Details
23.08.2012 22:41:12 2.0 Asia Turkey Edirne Enez VulkĂĄn 0 There are airport(s) nearby the epicenter. VulkĂĄn 0 EMSC Details
23.08.2012 21:40:25 3.0 South-America Chile Maule Molina VulkĂĄn 0 There are airport(s) nearby the epicenter. VulkĂĄn 0 EMSC Details
23.08.2012 21:40:47 2.4 Europe Italy Emilia-Romagna San Prospero VulkĂĄn 0 There are airport(s) nearby the epicenter. VulkĂĄn 0 EMSC Details
23.08.2012 22:41:56 4.2 Indonesian Archipelago Indonesia Maluku Utara Tobelo VulkĂĄn 0 There are airport(s) nearby the epicenter. VulkĂĄn 0 EMSC Details
23.08.2012 20:56:11 2.6 Middle America Mexico Baja California Progreso There are volcano(s) nearby the epicenter. There are airport(s) nearby the epicenter. VulkĂĄn 0 USGS-RSOE Details
23.08.2012 20:40:21 3.3 Europe Romania Racovita VulkĂĄn 0 There are airport(s) nearby the epicenter. VulkĂĄn 0 EMSC Details
23.08.2012 20:40:43 2.4 Europe Italy Calabria Salerni VulkĂĄn 0 VulkĂĄn 0 VulkĂĄn 0 EMSC Details
23.08.2012 19:30:32 2.8 North America United States Alaska Aleneva There are volcano(s) nearby the epicenter. VulkĂĄn 0 VulkĂĄn 0 USGS-RSOE Details
23.08.2012 19:30:56 2.6 North America United States Alaska Mentasta Lake VulkĂĄn 0 VulkĂĄn 0 VulkĂĄn 0 USGS-RSOE Details
23.08.2012 19:35:24 4.6 Indonesian Archipelago Indonesia Komodo VulkĂĄn 0 VulkĂĄn 0 VulkĂĄn 0 EMSC Details
23.08.2012 19:35:48 2.1 Montenegro Trsa VulkĂĄn 0 There are airport(s) nearby the epicenter. VulkĂĄn 0 EMSC Details
23.08.2012 19:01:24 5.0 North Pole Nepal Tulsipur VulkĂĄn 0 VulkĂĄn 0 VulkĂĄn 0 USGS-RSOE Details
23.08.2012 19:36:08 5.1 Asia Nepal Tulsipur VulkĂĄn 0 VulkĂĄn 0 VulkĂĄn 0 EMSC Details
23.08.2012 17:35:30 3.4 North America United States Alaska Aleneva There are volcano(s) nearby the epicenter. VulkĂĄn 0 VulkĂĄn 0 USGS-RSOE Details
23.08.2012 18:30:47 2.4 Europe Italy Emilia-Romagna Solignano Nuovo VulkĂĄn 0 There are airport(s) nearby the epicenter. VulkĂĄn 0 EMSC Details
23.08.2012 17:20:28 2.1 North America United States Hawaii Waimea There are volcano(s) nearby the epicenter. VulkĂĄn 0 VulkĂĄn 0 USGS-RSOE Details
23.08.2012 17:25:26 2.0 Asia Turkey Mu?la Yatagan VulkĂĄn 0 There are airport(s) nearby the epicenter. VulkĂĄn 0 EMSC Details
23.08.2012 18:31:28 3.7 Europe Russia Sakhalin Vostok VulkĂĄn 0 VulkĂĄn 0 VulkĂĄn 0 EMSC Details
23.08.2012 17:25:48 3.8 Asia Kazakhstan Zhambyl Khantau VulkĂĄn 0 VulkĂĄn 0 VulkĂĄn 0 EMSC Details
23.08.2012 16:15:33 2.4 North America United States Alaska Ugashik There are volcano(s) nearby the epicenter. VulkĂĄn 0 VulkĂĄn 0 USGS-RSOE Details
23.08.2012 16:16:01 2.1 North America United States California Cobb There are volcano(s) nearby the epicenter. VulkĂĄn 0 VulkĂĄn 0 USGS-RSOE Details
23.08.2012 16:25:21 3.2 Europe Greece Crete Platanos VulkĂĄn 0 There are airport(s) nearby the epicenter. VulkĂĄn 0 EMSC Details
23.08.2012 15:10:39 2.1 North America United States Alaska Ninilchik There are volcano(s) nearby the epicenter. VulkĂĄn 0 VulkĂĄn 0 USGS-RSOE Details
23.08.2012 13:10:35 2.2 North America United States California Indio Hills VulkĂĄn 0 There are airport(s) nearby the epicenter. VulkĂĄn 0 USGS-RSOE Details
23.08.2012 13:25:51 4.4 Asia Russia Shikotan VulkĂĄn 0 VulkĂĄn 0 VulkĂĄn 0 USGS-RSOE Details
23.08.2012 14:20:19 4.8 Europe Russia Shikotan VulkĂĄn 0 VulkĂĄn 0 VulkĂĄn 0 EMSC Details
23.08.2012 13:45:38 4.7 Pacific Ocean Fiji Northern Lambasa VulkĂĄn 0 VulkĂĄn 0 VulkĂĄn 0 USGS-RSOE Details
23.08.2012 14:20:47 4.6 Pacific Ocean – East Fiji Northern Lambasa VulkĂĄn 0 VulkĂĄn 0 VulkĂĄn 0 EMSC Details
23.08.2012 19:36:43 2.3 North America United States California Furnace Creek VulkĂĄn 0 VulkĂĄn 0 VulkĂĄn 0 USGS-RSOE Details
23.08.2012 12:10:34 2.3 North America United States California Furnace Creek VulkĂĄn 0 VulkĂĄn 0 VulkĂĄn 0 USGS-RSOE Details

……………………………..

East Coast earthquake created a ‘new normal’

BEN NUCKOLS, Associated Press, STEVE SZKOTAK, Associated Press
  • FILE - In this Aug. 23, 2011, file photo, a U.S. Park Service helicopter flies between the Washington Monument and the Capitol on the National Mall in Washington, following an earthquake in the Washington area. The unexpected jolt cracked the Washington Monument in spots and toppled delicate masonry high atop the National Cathedral. The shaking was felt far along the densely populated Eastern seaboard from Georgia to New England. While West Coast earthquake veterans scoffed at what they viewed as only a moderate temblor, last year’s quake has forever changed the way officials along the East Coast view emergency preparedness. Photo: AP / AP
    FILE – In this Aug. 23, 2011, file photo, a U.S. Park Service helicopter flies between the Washington Monument and the Capitol on the National Mall in Washington, following an earthquake in the Washington area. The unexpected jolt cracked the Washington Monument in spots and toppled delicate masonry high atop the National Cathedral. The shaking was felt far along the densely populated Eastern seaboard from Georgia to New England. While West Coast earthquake veterans scoffed at what they viewed as only a moderate temblor, last year’s quake has forever changed the way officials along the East Coast view emergency preparedness. Photo: AP / AP

MINERAL, Va. (AP) — When the “Big One” rocked the East Coast one year ago, the earthquake centered on this rural Virginia town cracked ceiling tiles and damaged two local school buildings so badly that they had to be shuttered for good. Now as the academic year gets under way, students are reciting a new safety mantra: Drop, cover, and hold on.

Earthquake drills are now as ubiquitous as fire drills at Louisa County schools in central Virginia, where 4,600 students were attending classes when the 5.8-magnitude quake struck nearby on Aug. 23, 2011. Miraculously, no one was seriously hurt.

“It’s the new normal,” Superintendent Deborah D. Pettit said of the earthquake drills. “It’s become a normal part of the school routine and safety.”

One such drill is planned for Thursday at 1:51 p.m. EDT — the precise moment a year ago when the quake struck.

The unexpected jolt cracked the Washington Monument in spots and toppled delicate masonry high atop the National Cathedral. The shaking was felt far along the densely populated Eastern seaboard from Georgia to New England.

While West Coast earthquake veterans scoffed at what they viewed as only a moderate temblor, last year’s quake has changed the way officials along the East Coast view emergency preparedness.

Emergency response plans that once focused on hurricanes, tornadoes, flooding and snow are being revised to include quakes. Some states have enacted laws specifically related to the quake, and there is anecdotal evidence of a spike in insurance coverage for earthquake damage.

The quake was centered 3 to 4 miles beneath Mineral, a town of fewer than 500 people about 50 miles northwest of Richmond. Yet it was believed to have been felt by more people than any other in U.S. history.

The damage, estimated at more than $200 million, extended far beyond rural Louisa County. In the nation’s capital, the Washington Monument sustained several large cracks and remains closed indefinitely.

The National Park Service plans next month to finalize the contract to repair the Washington Monument. Repairs are expected to cost $15 million and require a massive scaffolding, and the landmark obelisk is likely to remain closed until 2014.

The National Cathedral reopened last November, but repairs are expected to take years and cost $20 million. The cathedral announced Thursday that it has received a $5 million grant from the Indianapolis-based Lilly Endowment Inc. With that funding in place, stonemasons were scheduled to begin active restoration Thursday afternoon. Previously, they had been stabilizing the damaged components and cataloging the damage.

In Virginia, the North Anna Power Station became the first operating U.S. nuclear power plant shut down because of an earthquake.

Was it a once-in-a-century anomaly, or are there more quakes to come?

Scientists are trying to answer that question as they pore over the data and survey the epicenter from the air.

According to the U.S. Geological Survey, much of central Virginia has been labeled for decades as an area of elevated seismic hazard. But last year’s quake was the largest known to occur in that seismic zone.

“Scientists would like to know if this earthquake was Virginia’s ‘Big One,’” said J. Wright Horton of the USGS.

Meanwhile, the quake prompted several jurisdictions to revise their emergency response plans.

“We learned a lot, that’s for sure,” said Laura Southard, a spokeswoman for the Virginia Department of Emergency Management. One lesson, she said: the need to conduct post-quake assessments to size up damage.

Ultimately, 6,400 homeowners and renters in nine Virginia localities received $16.5 million from the Federal Emergency Management Agency.

*********************************************************************************************************************************

Volcanic Activity

Tungurahua Volcano, Ecuador, activity update: increasing explosive activity

BY: T

Photographs of the inner crater inside the outer crater, the presence of magma inside the inner crater and pyroclastic deposits in the crater. (S. Vallejo and MF. Naranjo, OVT-IGEPN)

Photographs of the inner crater inside the outer crater, the presence of magma inside the inner crater and pyroclastic deposits in the crater. (S. Vallejo and MF. Naranjo, OVT-IGEPN)

Small pyroclastic flow on the western flank of the volcano in the afternoon of August 21, 2012 (IGEPN)

Small pyroclastic flow on the western flank of the volcano in the afternoon of August 21, 2012 (IGEPN)

Thermal image of the continuous emission of gases and ash accompanied by expulsion of incandescent material (Source: S. Vallejo, OVT-IG)

Thermal image of the continuous emission of gases and ash accompanied by expulsion of incandescent material (Source: S. Vallejo, OVT-IG)

Thermal image of the northern flank of the volcano with fresh pyroclastic deposits and the trace of the lava flow recorded on Saturday August 18 (S. Vallejo, OVT-IGEPN)

Thermal image of the northern flank of the volcano with fresh pyroclastic deposits and the trace of the lava flow recorded on Saturday August 18 (S. Vallejo, OVT-IGEPN)

Current seismic signal (RETU station, IG)

Current seismic signal (RETU station, IG)

Tremor signal on current seismic recording (RETU station, IG)

Tremor signal on current seismic recording (RETU station, IG)

SO2 plume from Tungurahua yesterday 21 Aug (NOAA)

SO2 plume from Tungurahua yesterday 21 Aug (NOAA)

Tungurahua’s eruption continues. This morning, a tall ash plume was rising to 32,000 ft (ca. 10 km) altitude and drifting west. A slight decrease in tremor is visible on the latest seismograms.
So far, effects of the eruption have been limited to ash fall. In canton Quero, the ash fall during the past days has damaged more than 5000 hectares of plant cultivations and hit about 2.000 families.
In the meanwhile, scientists from the volcano observatory have made an overflight of the volcano and posted the following interesting update (freely translated) for 20-21 Aug:

The volcano emits a neary constant eruption column, associated with explosions, that reached a maximum height of 5 km and an average height of 1.5 km above the crater, with moderate ash content, drifting to the west. There were no new reports of ash fall.
An increase in the number and size of the explosions was observed since 15:00 local time on 20 Aug. Until 16:00 on 21 Aug, there were 16 large explosions producing strong cannon-shot noises heard in villages near the volcano and in cities as far away as Ambato, Riobamba and Miracle.
The seismic activity at Tungurahua shows a constant tremor signal associated with steam, gas and ash emissions.
Otherwise, the roaring noises have decreased in intensity and duration with respect to the previous days.
In the evening observatory staff observed constant expulsion of hot material in jets. Lava blocks landed outside the crater and rolled up to 1.5 km from the top of the volcano’s flanks.

An explosion at 14:11 on 21 Aug generated an ash column rising 4 km above the crater, that produced a small pyroclastic flow that descended approximately 2.5 km along the Achupashal creek.

Staff of the Geophysical Institute of the National Polytechnic School conducted an overflight of the volcano yesterday afternoon for thermal and visual monitoring of the activity in the crater area and top of the mountain. They observed that that much of the western and southwestern flank have been covered by fresh ash and blocks.
Thermal images show near continuous explosive activity from the inner crater, ejecting incandescent material onto the the upper flanks of the volcano, where temperatures ranged between 116 and 150°C.

The morphology of the summit consists of an outer crater containing an inner crater about 80 m wide, and a few dozend meters distance from the outside crater. The inner crater was observed to be almost filled with fresh lava. Numerous large meter sized hot blocks could be identified in the crater area and the upper flanks. Temperatures measured at the crater raned between 550°C for the inner crater and 236°C at the outer crater.

Many fresh lava blocks have accumulated in ravines on the south-west, west and north-west upper flanks of the volcano. These could be mobilized to form avalanches IG scientists warn.

The thermal image analysis confirmed that during the night of Saturday, August 18, a lava flow and an incandescent avalanche of blocks that had accumulated in the north-western flank flew down through the Cusu canyon as had been observed then.

IG recommends the authorities and the general public to maintain protective and preparative measures in case the activity escalates further which is a possibility. Most danger during the ongoing activity comes from pyroclastic flows, lahars and ash fall.


Links / Sources:
Read more…

Extreme Temperatures/ Weather & Forest Fires

Earth Watch Report – Friday August 24th, 2012

by desertrose

Extreme Temperatures/ Weather

Climate vs. weather: Extreme events narrow the doubts

An aerial view of New Yorkers taking in the sun on a beach at Coney Island on August 4, 2012 in the Brooklyn borough of New York City. (Mario Tama/Getty Images/AFP)

PARIS: Heat waves, drought and floods that have struck the northern hemisphere for the third summer running are narrowing doubts that man-made warming is disrupting Earth’s climate system, say some scientists.

Climate experts as a group are reluctant to ascribe a single extreme event or season to global warming.

Weather, they argue, has to be assessed over far longer periods to confirm a shift in the climate and whether natural factors or fossil-fuel emissions are the cause.

But for some, such caution is easing.

A lengthening string of brutal weather events is going hand in hand with record-breaking rises in temperatures and greenhouse-gas levels, an association so stark that it can no longer be dismissed as statistical coincidence, they say.

“We prefer to look at average annual temperatures on a global scale, rather than extreme temperatures,” said Jean Jouzel, vice chairman of the U.N.’s Nobel-winning scientists, the Intergovernmental Panel on Climate Change.

Even so, according to computer models, “over the medium and long term, one of the clearest signs of climate change is a rise in the frequency of heat waves”, he said.

“Over the last 50 years, we have seen that as warming progresses, heat waves are becoming more and more frequent,” Jouzel said.

“If we don’t do anything, the risk of a heat wave occurring will be 10 times higher by 2100 compared with the start of the century.”

The past three months have seen some extraordinary weather in the United States, Europe and East and Southeast Asia.

The worst drought in more than 50 years hit the U.S. Midwest breadbasket while forest fires stoked by fierce heat and dry undergrowth erupted in California, France, Greece, Italy, Croatia and Spain.

Heavy rains flooded Manila and Beijing and China’s eastern coast was hit by three typhoons in a week.

Last month was the warmest ever recorded for land in the northern hemisphere and a record high for the contiguous United States, according to the U.S. National Oceanic and Atmospheric Administration.

Globally, the temperature in July was the fourth highest since records began in 1880, it said.

James Hansen, arguably the world’s most famous climate scientist (and a bogeyman to climate skeptics), contends the link between extreme heat events and global warming is now all but irrefutable.

The evidence, he says, comes not from computer simulations but from weather observations themselves.

In a study published this month in the peer-reviewed U.S. journal Proceedings of the National Academy of Sciences, Hansen and colleagues compared temperatures over the past three decades to a baseline of 1951-80, a period of relative stability.

Over the last 30 years, there was 0.5-0.6 C (0.9-1.0 F) of warming, a rise that seems small but “is already having important effects”, said Hansen, director of NASA’s Goddard Institute for Space Studies.

During the baseline period, cold summers occurred about a third of the time, but this fell to about 10 percent in the 30-year period that followed.

Hot summers, which during the baseline period occurred 33 percent of the time, rose to about 75 percent in the three decades that followed.

Even more remarkable, though, was the geographical expansion of heat waves. During the baseline period, an unusually hot summer would yield a heat wave that would cover just a few tenths of 1 percent of the world’s land area.

Today, though, an above average summer causes heat waves that in total affect about 10 percent of the land surface.

“The extreme summer climate anomalies in Texas in 2011, in Moscow in 2010 and in France in 2003 almost certainly would not have occurred in the absence of global warming with its resulting shift of the anomaly situation,” says the paper.

In March, an IPCC special report said there was mounting evidence of a shift in patterns of extreme events in some regions, including more intense and longer droughts and rainfall.

But it saw no increases in the frequency, length or severity of tropical storms.

Costs of big wildfire season hurting some states

Budgets leave governments in tough spot to get people, planes, bulldozers to beat back flames

Image: Burned debris near Manton, Calif.

Jeff Barnard  /  AP

A damaged truck sits among other remains on Wednesday at a rural house site outside Manton, Calif., where a huge wildfire burned through on Saturday, forcing residents to evacuate.

By Jeff Barnard and Nicholas K. Geranios

MANTON, Calif. — Twisted sheets of metal, the hulks of pickup trucks and brick walls were all that was left of homes once sheltered by green pine and cedar trees.

In a rural Northern California subdivision that was the latest to feel the wrath of massive western wildfires, long pine needles bent back on themselves, unburned but dried to a brittle dusty gray by the intensive heat of the Ponderosa fire.

Thousands of residents of tiny rural communities just outside Lassen Volcanic National Park who had been forced to flee soon after the fire was ignited by lighting on Saturday were allowed to return home on Wednesday. But hundreds of other homes were threatened as the fire burned a new front on the southern flank.

The blaze has grown to 44 square miles in the hills about 30 miles east of Redding.

Bob Folsom, who works at a nearby hydroelectric facility, tended the gasoline generator that is keeping his refrigerator running while utility crews worked to replace power lines destroyed by the blaze when it roared through the area last weekend.

“I was ready for this day,” he said. “I try to be self-sufficient.”

Folsom and his son never left their home as the fire burned within a half mile of them last weekend, close enough that they heard trees exploding and the flames roaring like a freight train. Over the past 10 years, they had thinned hundreds of trees, dug a pond to store water, and installed hydrants to fill fire hoses.

“When it comes through, it’s gonna come fast,” he said. “You don’t have time to cut down trees.”

Fires across the West have left some states with thin budgets to scramble to get people, planes, bulldozers and other tools on fire lines to beat back the flames.

And that’s with about a third of the annual wildfire season remaining.

Video: Ponderosa blaze prompts state of emergency (on this page)According to the National Interagency Fire Center in Boise, Idaho, the nation as of Wednesday had seen 42,927 wildfires this year, which burned just over 7 million acres.

While the number of fires is down from the 10-year average of 54,209 as of Aug. 22, the acreage was well above the average of 5.4 million acres, said Don Smurthwaite, a NIFC spokesman.

“The fires are bigger,” he said.

In Colorado Springs, Colo., this summer, about 350 homes were burned in the most destructive wildfire in state history. Another fire in northern Colorado just before it scorched 257 homes.

The costs have mounted, not just in the damage to houses and other buildings.

In Utah, for example, officials have spent $50 million as of mid-August to fight more than 1,000 wildfires, far surpassing the $3 million a year the Legislature budgeted for fighting wildfires.

The state’s share is estimated at $16 million, said Roger Lewis of the Utah Division of Forestry, Fire and State Lands. He said lawmakers will need to figure out how to come up with $13 million.

That’s the largest-ever supplemental appropriation request needed for firefighting in the state, agency spokesman Jason Curry said. He said, “It’s obviously been a big year.”

Washington state fire officials project that they will spend about $19.8 million on emergency fire suppression activities in the current fiscal year that ends next June.

That is expected to far surpass the $11.2 million the agency was allotted for such work, meaning the Department of Natural Resources will have to ask the Legislature for supplemental funds.

Not all Western states are seeing their budgets busted because of fires.

In Oregon, the state estimated it had spent $3.4 million through last Saturday to fight wildfires, with more than two months of the season left. Last year, it spent $6.6 million.

In Montana, forest managers told Gov. Brian Schweitzer that long-term forecasts call for fire conditions through the end of September, which is longer than normal.

The Northern Rockies Coordination Center put the total cost of fighting large wildfires in Montana, including costs to federal and state agencies, at $64 million so far this season. The state’s share is about $25 million to fight fires that have burned about 1,100 square miles.

Schweitzer said the state has already burned through cash reserves set aside for such natural disasters, but that plenty of money is available from surplus general funds.

While parts of the Southwest, particularly Southern California, still have three months of fire season left, Smurthwaite said, shorter days, declining temperatures and higher humidity will help curtail fires.

“That’s almost like putting a little wet blanket over a fire,” he said.

Firefighters in Northern California on Thursday made progress in containing a huge wildfire that has burned 80 homes and other buildings and is threatening 900 more. It was 57 percent contained on Thursday.

Fire crews assessing the rural area determined Thursday that 84 buildings had been destroyed since it was sparked by lightning Saturday. It was unclear when the structures burned and how many were homes.

More than 2,500 firefighters were battling the fire near several remote towns about 170 miles north of Sacramento.

Elsewhere in California, a large wildfire in Plumas National Forest continued to expand, helped by gusty winds.

In Washington state, fire crews still hoped to fully contain a week-old wildfire that has destroyed 51 homes and 26 outbuildings and damaged at least six other homes, authorities said.

The fire, about 75 miles east of Seattle, has caused an estimated $8.3 million in property damage.

In south-central Idaho, authorities have spent more than $23 million fighting a fire near the towns of Pine and Featherville and another in a forest near the resort town of Stanley.

Those wildfires have each consumed about 150 square miles, and will not be extinguished for some time, Smurthwaite said.

“We expect to be managing them for weeks to come,” he said.

Associated Press writers Haven Daley in Manton Calif., Jonathan Cooper in Salem, Ore., Brian Skoloff in Salt Lake City, Terry Collins, John S. Marshall and Terence Chea in San Francisco, Shannon Dininny in Yakima, Wash., Mike Baker in Olympia, Wash., and Jessie Bonner in Boise, Idaho, contributed to this report.

23.08.2012 Forest / Wild Fire USA State of California, [Plumas National Forest] Damage level Details

Forest / Wild Fire in USA on Wednesday, 01 August, 2012 at 02:59 (02:59 AM) UTC.

Back

Updated: Thursday, 23 August, 2012 at 05:11 UTC
Description
California Governor Jerry Brown declared a state of emergency in three Northern California counties on Wednesday after officials said wildfires in the region had destroyed at least 50 buildings and were threatening hundreds more. Some 3,000 people have been evacuated as the so-called Ponderosa fire burned through more than 24,000 acres (9,700 hectares) of steep, rugged terrain in the rural counties of Tehama and Shasta, about 125 miles (200 km) north of state capital Sacramento. The blaze is 50-percent contained, fire officials said. Brown also declared a state of emergency in nearby Plumas County, where a fire has burned through 47,000 acres (19,000 hectares). Declaring a state of emergency frees up funds to help battle the fires. Firefighters on Wednesday were expected to start inspecting the damage from the Ponderosa fire, which they surveyed by air on Tuesday. Efforts to prevent the fire from overrunning the rural towns of Manton and Shingletown have succeeded so far despite high winds and heat, fire officials said.
23.08.2012 Forest / Wild Fire USA State of Washington, [Ahtanum Forest, Yakima County] Damage level Details

Forest / Wild Fire in USA on Thursday, 23 August, 2012 at 09:54 (09:54 AM) UTC.

Description
State officials have closed part of Ahtanum State Forest to help fight a wildfire burning in a closed section of the Yakama reservation about 15 miles northwest of White Swan. Steep terrain is hampering firefighters efforts to contain the blaze, said Sarah Foster, a spokeswoman for the state fire management team that took over the 331-acre fire early Wednesday. The team’s staging camp is in the closed state forest land, which covers Ahtanum Meadows, Ahtanum Campground, Whites Ridge Trailhead and Middle Fork Road. The closures, which were enacted by the state Department of Natural Resources, are expected to last through the weekend, Foster said. Other parts of the state forest, including South Fork Road, Nasty Creek Road, North Fork Road and Jackass Road, are still open to the public. Lightning sparked the fire Sunday. About 200 firefighters and support people are working to contain the flames, which are burning in lodge pole pine trees in the Diamond Butte area. There are no structures in the area. The fire’s commanders want to keep the flames from reaching forested land with heavy infestation of mountain pine beetles. The insects’ activity kill trees, which creates ready fuel for wildfire, Foster said. “Those dead trees burn really rapidly.” Calm weather conditions are expected until Friday, when a cool front will bring lower temperatures and higher winds, she said. Helicopters and nine hand crews worked Wednesday to make progress on the fire. The helicopters are flying out of an area a couple miles outside Tampico. As many as 350 firefigthers could be called in to corral the fire, she said. Some of them could come from the Taylor Bridge Fire, where the incident commanders are starting to reduce the number of crews. In Washington, firefighters can work 14 days on a fire, then have to take 24 hours off before going back out.
Read more…

Crossroads News : Changes In The World Around Us And Our Place In It

Community  :  IT / Emergency Networks

Home Wi-Fi routers could operate as emergency network, say scientists

Researchers propose disaster ‘emergency mode’

By John E Dunn, TechWorld

German researchers have proposed using home Wi-Fi routers as a backup mesh network in the event that cell and phone systems in cities and towns are overwhelmed during emergencies.

In a recently-published paper PDF, Kamill Panitzek and colleagues at the Technical University in Darmstadt in Germany describe how home routers could be linked to one another to form a huge informal backbone for use by fire, police and ambulance services.

REVIEW: Linksys routers get smart (except for ‘easy setup’)

Panitzek and his team tested the concept in the centre of Darmstadt by surveying the number, signal strength and location of routers using a sophisticated version of wardriving that was able to fix their coordinates with a high enough degree of accuracy to construct a hypothetical mesh.

The team found 1,971 routers, 212 of which had no encryption applied, and a further that used the obsolete WEP standard.

On the basis of the pattern of routers found, the team calculated that a resilient and sufficiently dense mesh network would be possible if a distance of around 30 metres between nodes was assumed.

One problem was that there were not enough open (i.e unsecured) routers which would require citizens to create an “emergency switch” mode to allow access to the number of nodes needed to create a viable mesh.

Most recent home routers can support such a system without modification as long as they allow for the creation of an open ‘guest’ network running in parallel to the user’s secured Wi-Fi access, that is firewalled from it.

“We found that with a communication range of 30 metres a mesh network could be easily constructed in urban areas like our hometown. The resulting networks showed to be resilient to node failures,” Panitzek said in the analysis.

The team accepts that there are some barriers to the idea beyond the mere density of routers available in a particular locality. Would users agree to have an open channel enabled on their routers?

A better idea might be for router makers to introduce an emergency mode into their products that users would know was fully secure, but the prospects of that look remote for now without legislation.

Mesh networks have been a buzz technology for some years and have found commercial applications. Arbua Networks launched a small meshing system for its own access points in 2011. Although a powerful idea, the technology remains on the fringes of development.

Read more…

Blog Topics by Tags

Monthly Archives